Life cycle assessment has become one of the standard methods used to assess the environmental and energy performance of processes over their complete life cycle, from material extraction and production to operation and maintenance (ISO 14040, 2006). Life cycle assessment (LCA) is extensively used in the area of urban water management, whether for the entire urban water system or a component of the system including wastewater treatment.
This project’s LCA plans are to assess the environmental footprint of the combined system over the life stages. We can determine the best maintenance strategies that cut down the ecological impact by reviewing the critical resource use and emissions.
The domain of focus is as follows:
- Finding out the collective amount of energy used to facilitate the complete life cycle processes
- Freshwater utilized across the lifespan
- CO2 emissions across the stages.
Scope and Goal
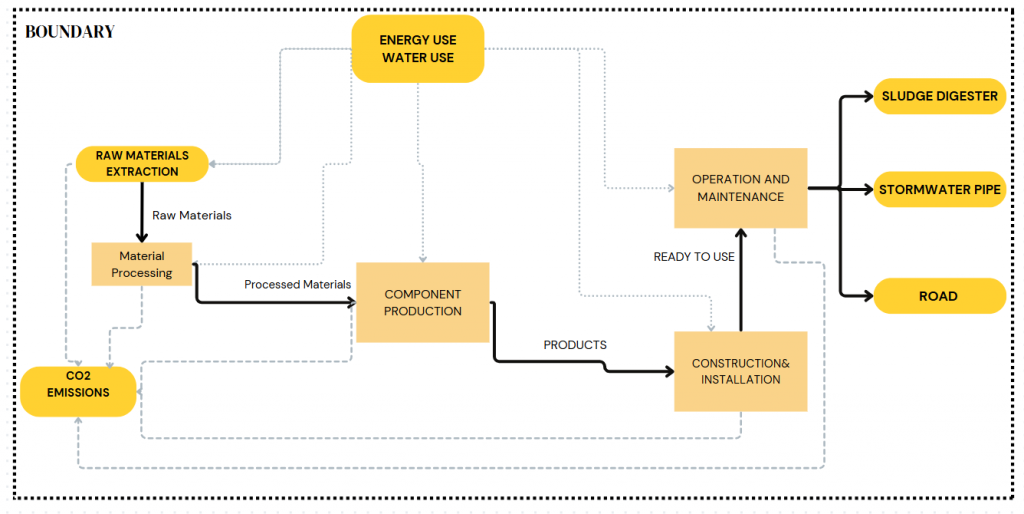
The figure below(Figure 1) depicts the system boundary for the Life Cycle Assessment (LCA) analysis, highlighting the important phases in the manufacturing, installation, and operation of system components, including sludge digesters, stormwater pipes, and roads and the parameters. By outlining these parameters, we hope to assist engineers in making decisions that maximize resource efficiency while maintaining long-term system performance.

The life cycle analysis portion of the R code recycles functions from previous studies to find the total life cycle energy, CO2 emissions, and water use based on the number of interventions. The interventions, which have already undergone optimization through the Pareto function, are optimized across all three systems.
The following LCI table was used to calculate the quantities of energy, CO2 and H2O over the lifetime, the scope of which includes the stages from the raw material extraction, processing, and production to the operation and maintenance of the urban system during its life cycle.
| material | scope | quantities | energy | CO₂ | H₂O (m³) |
| HDPE Polymer | HDPE | 324.66 | 16665.65 | 2527.83 | 3.96 (IPlex Pipelines, 2021) |
| Carbon Black | HDPE | 6.49 | 233.64 | 47.05 | 0 |
| Cement | PRC | 350 | 350 | 1.85 | 0.47 (Wayman et al., 2020) |
| Coarse Aggregates | PRC | 850 | 120 | 2.12 | 0 |
| Fine Aggregates | PRC | 500 | 80 | 0.63 | 0 |
| Reinforcement | PRC | 90 | 320 | 1.5 | 28.6 (Colla et al., 2017) |
Table 1: Life Cycle Inventory(LCI) used for LCA in R
For a comprehensive analysis, we also use the unit costs of each of the resources that we took into account, which is summarized in Table 2.

After the analysis, the total resource allocations and emissions, as well as the impact costs of the combined system over its lifecycle is as follows:

It is evident that energy consumption is the dominant factor amongst the group. It is reasonable as energy is most commonly used in each life cycle stages of the combined system, from extraction of raw materials to maintenance of systems. This constant use of energy thus results in high energy consumption.

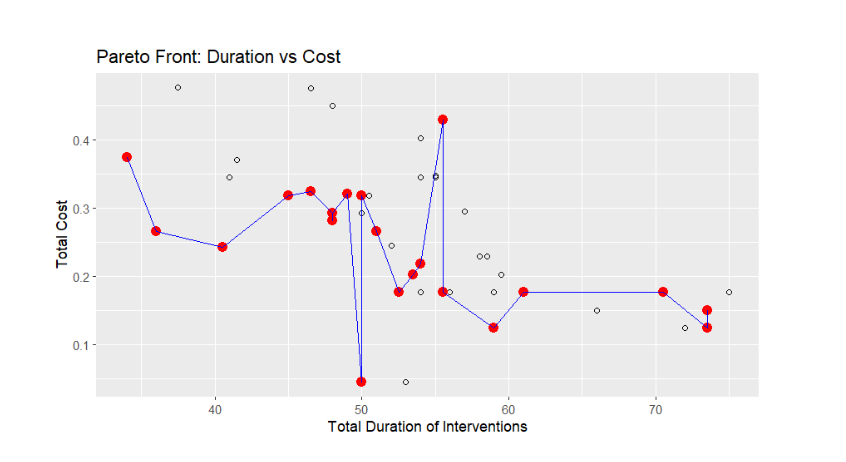
From Figure 2, the pareto plot of Total duration of Interventions and the Costs, a clear representation of trade-off between costs and duration of interventions are visible. Each point on the plot represents a viable maintenance option, where the red dots connected by the blue line represent the Pareto Optimal solutions. This highlights the trade-off where minimizing costs would demand higher duration of interventions and vice-versa. This visualization aids in determining the best maintenance strategy that strikes the balance between costs and system downtime.
References:
- Berliner Wasserbetriebe. (2019, December 6). Our Tariffs for Drinking Water and Drainage.BWB. https://www.bwb.de/en/1720.php#:~:text=The%20volumetric%20price%20is%20calculated,50.
- IPlex Pipelines. (2021, December). EPD-PE Pipes Environmental Product Declaration. IPlex Pipelines NZ Limited. https://www.iplex.co.nz/assets/Uploads/IPL0122_EPD_PE_Brochure_web_ready_2601-website.pdf.
- Colla, V., Matino, I., Branca, T. A., Fornai, B., Romaniello, L., & Rosito, F. (2017). Efficient Use of Water Resources in the Steel Industry. Water, 9(11), 874. https://doi.org/10.3390/w9110874.
- Wayman, M. , Hassan, K. E., & Al-Kuwari, M.S. (2020). Water Footprint Analysis of Construction Aggregates in Qatar. Towards a Sustainable Water Future: Proceedings of OICWE2020, 200-210. https://doi.org/10.1680/oicwe.65253.201.
→ Next Page: Multi-Objective Optimization