A life cycle inventory is a phase of life cycle assessment involving the compilation and quantification of inputs and outputs for a product throughout its entire life cycle. [1] Today the sustainable energy system of bonaire produces enough energy to support all of the inhabitants. Because of a population growth and an increasing tourism attendance on the island the energy system should become an upgrade. For the LCI/LCA five different processes are established. Production describes the process of farbrication of the subsystems. Transportation determines all the emissions and costs from the factory to the island. Installation process describes the assembly on the construction site. Three different maintenance methods are described separately. Operational output is the energy/CO2 which is produced/consumed by a system.
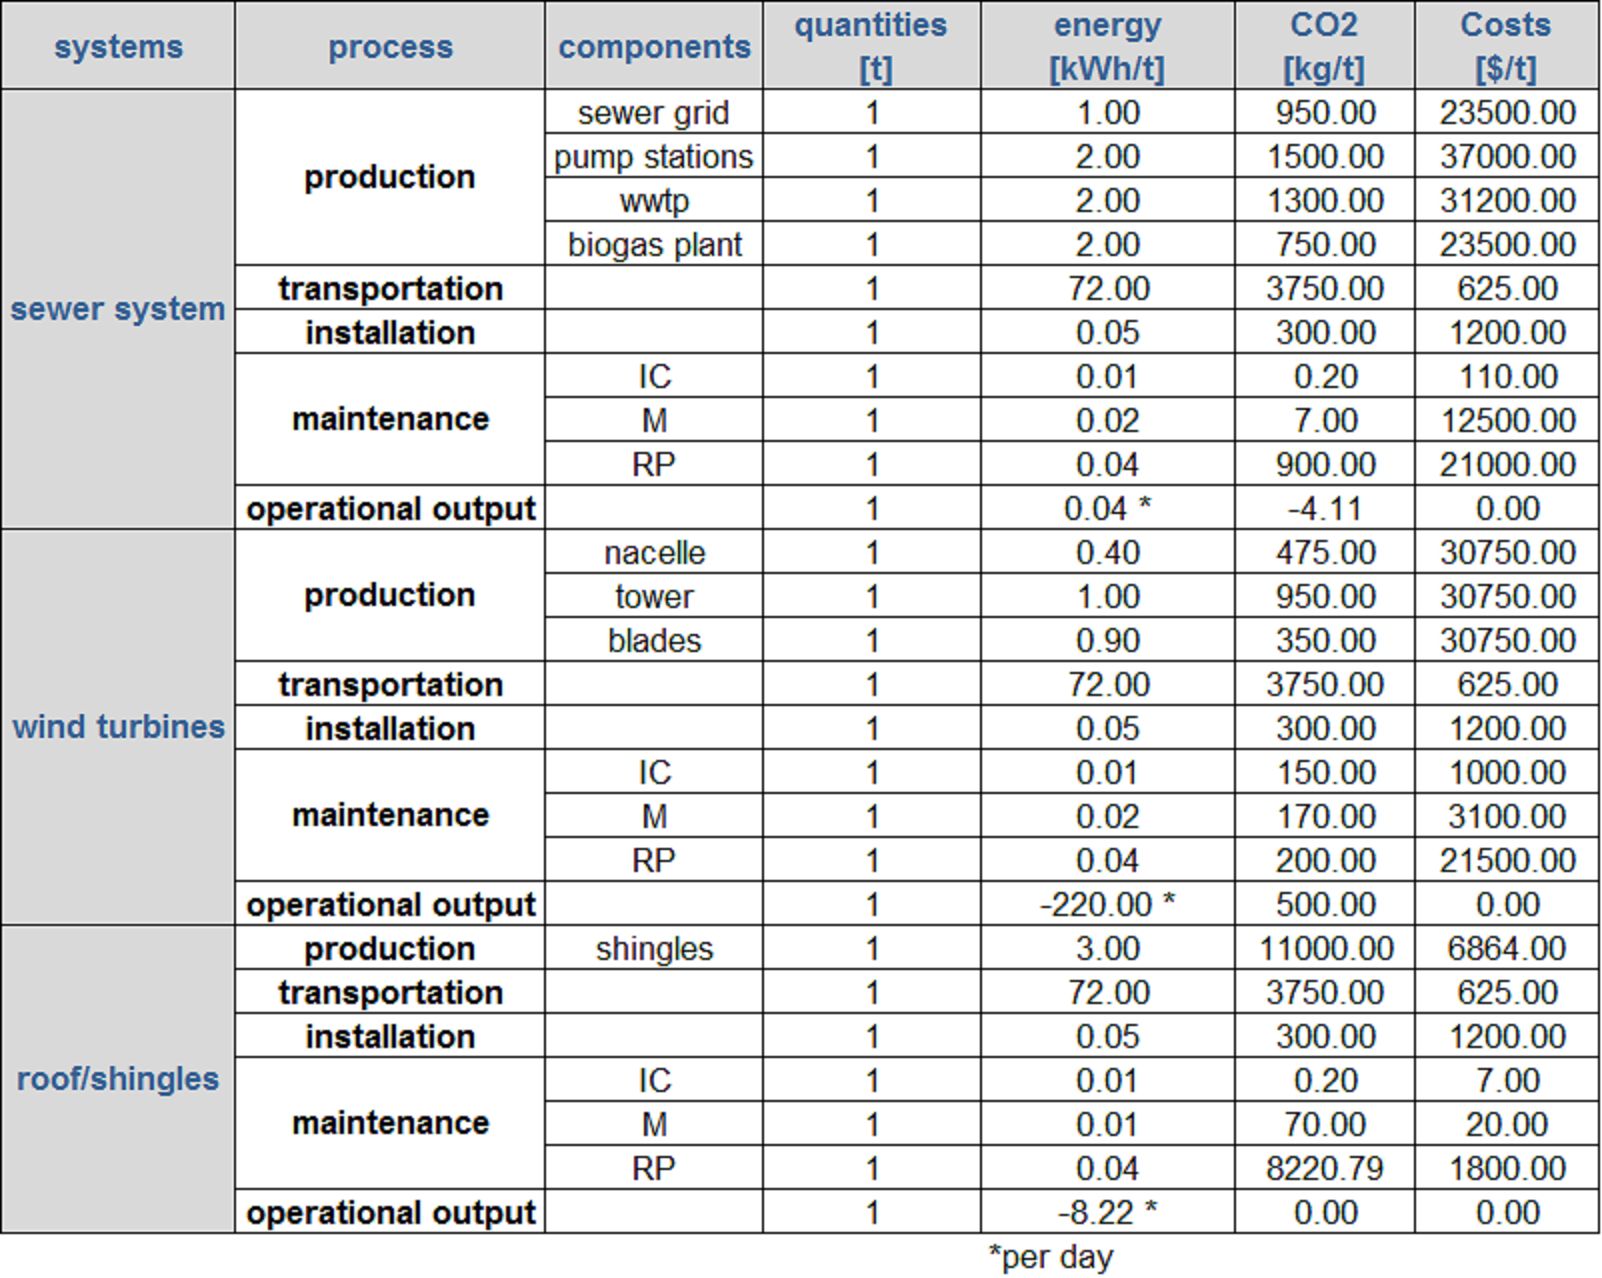
Figure 1 shows the energy consumption/production, CO2 emission/absorption and the cost for the three systems: sewer system, wind turbines and roofs of the houses. All the values were calculated per tonne using assumptions we will describe now:
Transportation
A vessel consumes about 0,4 MJ/(t*km). We assume that all parts which we need for the construction are shiped from Caracas, the capital of Venezuela, which is about 250 km from the port of Bonaire. That means a vessel consumes about 0,4*250*0,27=27 kWh/t for the shipment of the parts to the island. For the 250 km a vessel produces 15 g/(t*km)*250 km = 3,75 kg/t CO2 during the trip and costs 625 $/t . [3],[4]
Wind turbine
An average 2 MW wind turbine weights about 163 t and costs about 5 Mio $. It has three main components with the related mass ration: nacelle (33,7%), tower (46,1) and three blades (20,2). Based on the previous consideration we choosed the values for the energy consumption and CO2 emission. The cost per tonne are: 5 Mio. $/163t = 30750 $/t. For the installation a high CO2 emission for the machines with quite a small energy consumptions (as the energy is produced on the island) is assumed. The installation costs are about 5% of the fabrication costs. The values for energy and CO2 of the maintenance were assumed based on tesla vehicles which are used for the inspections. The replacement of the subsystems takes more time and consumes more ressources as a usual inspection and maintenance. The replacement costs for the whole system are about 90 % of the production costs from scratch (as they partky include the transportation and instalation). A medium wind turbine produces 220 kWh/t energy per day but also an emission of 500 kg/t during the whole lifecycle [5]
Sewer System
As a reference for calculating the amount of produced energy, the biogas plant in Braunschweig, Germany is being observed, where 50.000 kWh per day is produced by the waste water of 290.000 residents. [6] Bonaire has about 15.000 residents, so we calculate as following:
15.000 residents Bonaire/(290.000 residents Braunschweig) * (50.000 kWh Braunschweig) = 2.586 kWh/day for Bonaire Island
Because 1 m³ of water is roughly 1 t and we got the daily amount of waste water on Bonaire Island (4000 m³/d) [7], we can easily transform the daily energy:
2.586 kWh/day / 4000 m³/day = 0,6465 kWh/t
Tesla solar shingles
In the begining of 2018 Tesla anounced a soon market entry for their solar roof shingles which combine a conventional roof shell and a solar plant. The costs for the new roof are about 20 $/m² . [8] An average roof has 343 m²/t shingles and price of 6864 $/t.
As one of the basic ingridients for the shingles is silcium, the CO2 emission and the energy consumption for production are high. For the maintenance we make the same assumptions as for the wind turbines. The production of the energy shingles is about 8.22 kWh/t. The zero CO2 emission is an advantage during the lifecycle.
Life cycle analysis
The focus for the life cycle analysis is the description of renewable energy system cosidering the available systems on the island, the additional systems and their maintenance. At the start of the analysis 1.1.18 there are 2 sewer systems, 12 wind turbines and 0 roofs with solar shingles (all in all there area 5000 houses). In the next 100 years the goverment of Bonaire wants to bild 8 additional turbines and equip all the available roofs and the new 500 houses which will be constructed with the solar shingles. The sewer system doesn’t need an extension.
Considering the mass ration of the subsystems we calculate the related quontities for the energy, CO2 and costs. In the calculation of the total quontities we consider the different masses. For example the quontities for the instalation and transportation includes only systems which will be build in the future. For the quontities for the inspection and cleaning we consider the available and constructed turbines and multiply them by times of the maintenance types during the whole lifecycle. The result is the energy consumption/production, co2 emission and costs for the lifecycle of 100 years for the whole integrated system. Assuming the same consumption and emission every year the results are:
Energy[mWh] CO2[t] Costs [$]
-304923.6 19342555 5343283
Every year the energy system produces about 300 thousand mWh for the energy consumptions of the island. That is enough energy considering the growth of the population and the number of tourists. Additional produced energy can be saved in the tesla power walls. The CO2 emission for the construction, transportation, instalation and maintenance is about 19 Mio t/year. This is about the same value of CO2 emission as 9 Mio. passenger cars [10] This value shows that the emission for the construcion of renewable energy systems is ignored in the energy balance. The costs for the extensions and maintenance of the whole system is abou 5,3 Mio. $ per year. Considering a GDP of 20.000 $/year per person and 15000 residences on the island the total GDP is 300 Mio. $/year. In Germany 20% are used for national expense. Assuming the same at Bonaire and considering that 10% of this budget are sed for renewable energy the goverment would have a budget if 6 Mio $/year. [11],[12] That would be enough to follow their strategy.
Text
[1] Klöpffer, W. and Grahl, B., 2014, Life cycle assessment (LCA): a guide to best practice. Wiley-VCH.
[2] Umeweltbundesamt, 2017, https://www.umweltbundesamt.de/daten/verkehr/endenergieverbrauch-energieeffizienz-des-verkehrs#textpart-5
[3] Naturschutzbund Deutschland, https://www.nabu.de/umwelt-und-ressourcen/verkehr/schifffahrt/containerschifffahrt/16646.html
[4] Hamburger Abendblatt, 2013, https://www.abendblatt.de/wirtschaft/article120879968/Von-Asien-nach-Europa-fuer-einen-Cent.html
[5] Hau, E., 2005, Wind turbines: fundamentals, technologies, application, economics, Springer
[6] https://www.ingenieur.de/technik/fachbereiche/umwelt/klaeranlage-produziert-strom-fuer-7000-haushalte/
All sources last viewed 2018-02-12.