A life cycle inventory analysis is used to investigate the influence of a selection of input variables on the combined overall system of tram track, tunnel and bicycle underpass. The influence is evaluated over the entire life cycle using performance criteria, which are generated as output at the end of the analysis. In this study, the focus is on the following criteria:
- CO2-Emission
- NOx-Emission
- SO2-Emission
- Cost of the impact on the environment
Criteria such as LCC and energy, which were not considered in all individual systems, are omitted because the data are not complete. The result of this analysis should help civil engineers to optimize their decision process for the most environmentally friendly product with the least maintenance effort.
Since all systems have a different life cycle, a complete renewal is assumed at the end of the time. In this analysis, a life cycle of 70 years was chosen. However, the inventory is determined separately for each system and then multiplied by the lifetime / life cycle. This allows the analysis to be flexibly adjusted to different life cycles.
The already known geometric, material and type properties of the individual systems serve as input variables. If you have not yet read anything about this, switch to one of the individual systems on the right-hand side of the menu bar. In addition, the impact of the interventions over the life cycle is also taken into account. According to the strategies described under Maintenance Planning, four different strategies have been defined, as you can see in the following table.
Table 1 Input Parameters for Different Scenarios
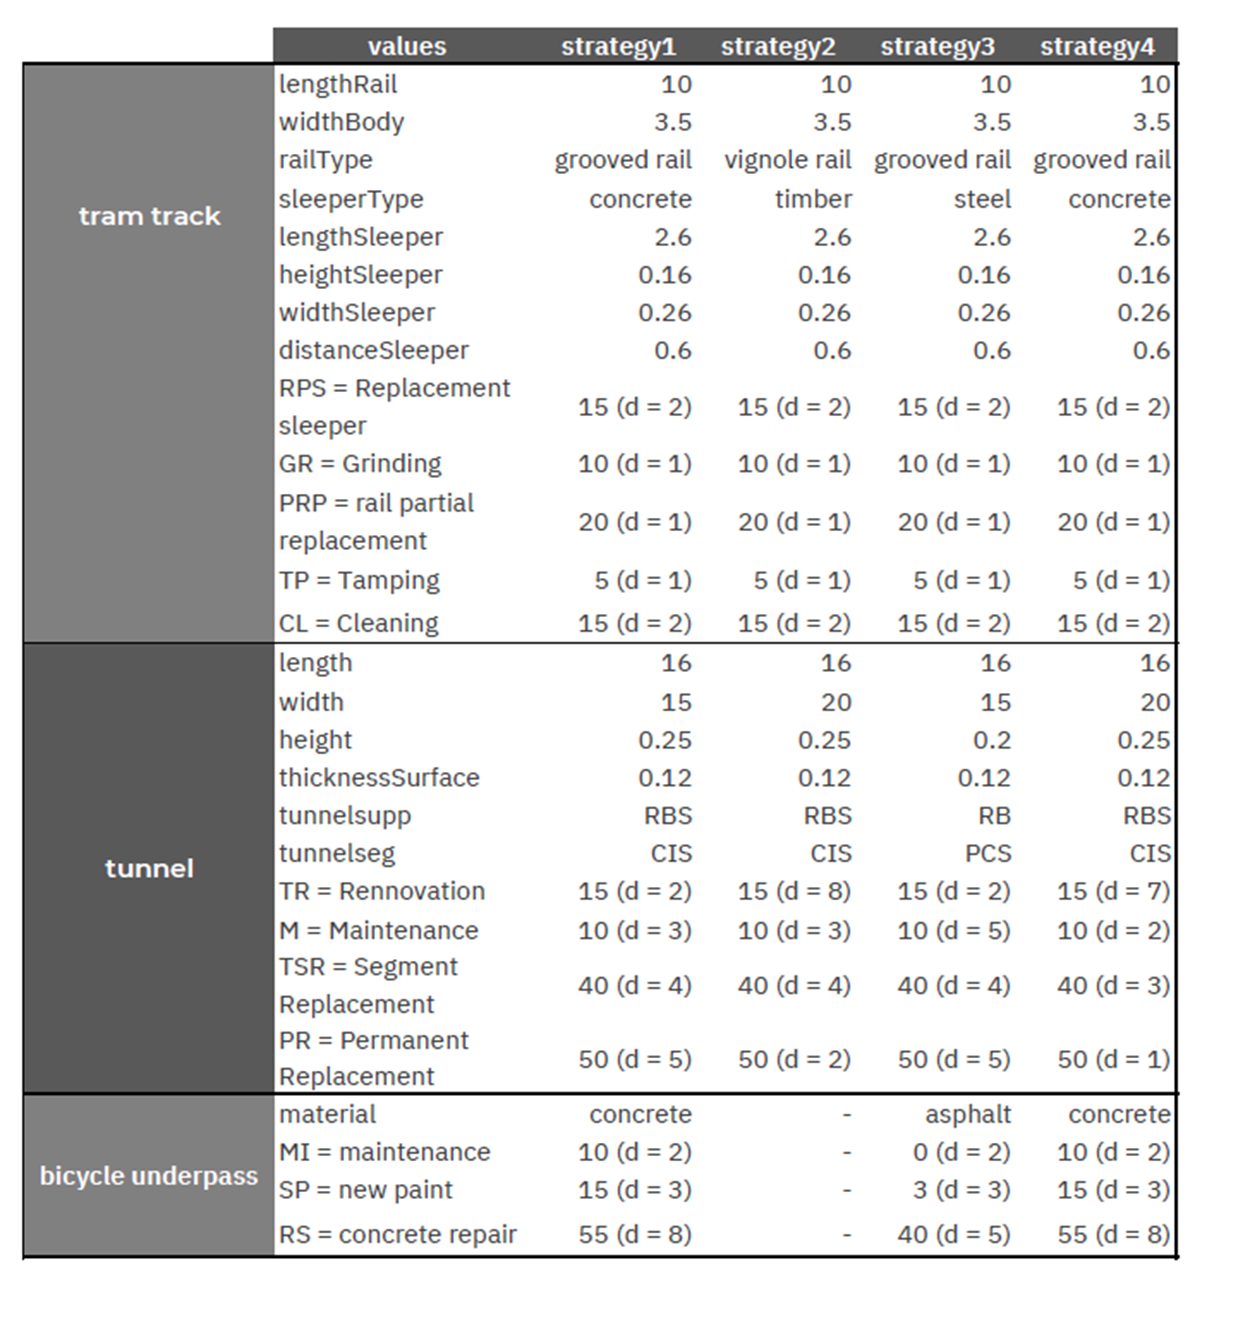
All systems refer to a 10 km long tram track with at least one NetElement. The Scenrio 1 describes a tram track with two underpasses. On the one hand a tunnel for car traffic and on the other hand a bicycle underpass. It is assumed that all systems will be maintained separately. Measures of tunnel and underpass are carried out in such a way that they do not affect the availability of the tram track. In the Strategy 2, motor vehicle traffic and bicyclists will be routed through a common tunnel. This has the advantage that instead of two spatially separated structures, one larger system must be maintained. Accordingly, the measures at bicycle underpass are omitted and those of the tunnel are increased. The second and third strategies also try to optimize the results of the tram track. The Strategy 3 corresponds to the second strategy. But now it tries to combine the measures of the two tunnels. For example, the maintenance measure, which recurs every 10 years, is bundled. In the last strategy (Strategy 4), the tunnel was not used as an underpass, but the track itself is led through the tunnel. Accordingly, combinations of measures between tunnel and underpass are much more difficult to implement and it can also be assumed that the geometric properties of the tunnel are greater when crossing under a body of water or a road than when crossing under a track.
Depending on the quantity or weight, the amount of C02, NOx and SO2 consumed over the life cycle was determined for each individual system. The exact values can also be found under the individual systems. This was supplemented by the calculation of the environmental impact costs. These were determined by means of the following value:
- CO2 <- 26 $ per metric tone
- NOx <- 42 $ per metric tone
- SO2 <- 85 $ per metric tone
The results of the individual systems were then added together to produce an overall result for the corresponding scenario. The following graph illustrates the results for the performance criteria CO2, NOx, SO2 and the costs on the x-axis and the quantity on the y-axis. It should be noted that the values for CO2 consumption are very high compared to the others and for this reason have been divided by 10 for this graph.
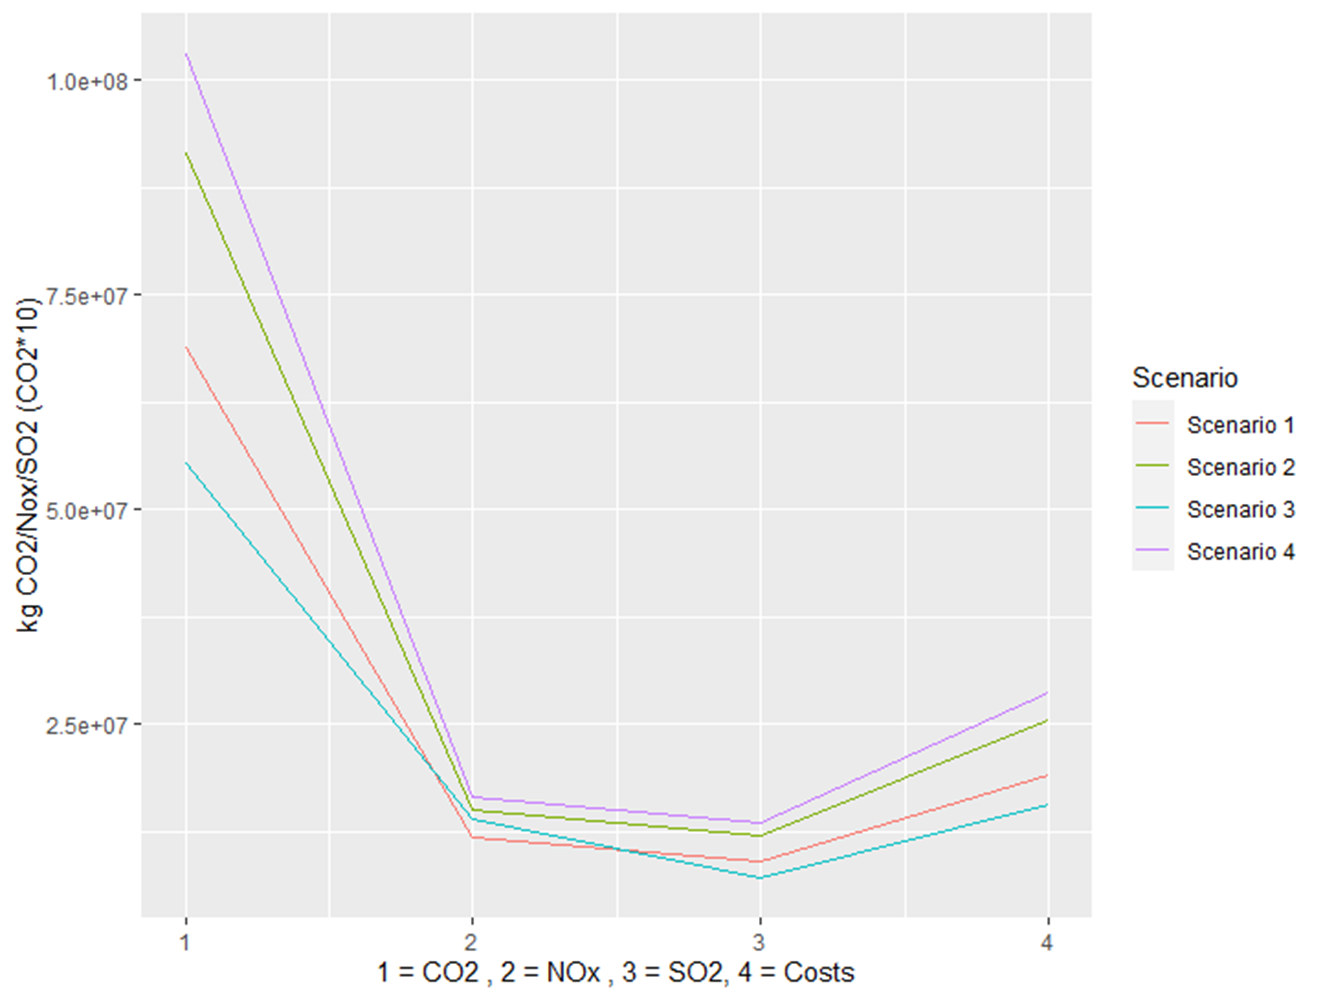
Image 1 Graphical Visualization of the Life Cycle Inventory Analysis
This graph shows very well that the change brought about by the various measures was relatively uniform. Option 3 performs best, followed by options 1, 2 and 4. The only exception NOx-Emission, where option 3 performs worse than the first option. Accordingly, option 4, which runs the track itself through the tunnel, appears to be the most unsuitable. Scenario two with a large tunnel instead of a parallel bicycle tunnel surprisingly has higher life cycle pollutant levels. However, due to the higher danger potential of motor vehicle traffic and bicycle traffic in a tunnel, this option would have to be reconsidered anyway. When investigating where the high uniformity of the graphs comes from, the different influence of the individual systems on the results also stood out. For example, the tunnel has significantly higher overall values, which means that changes to the track or the underpass only have a minimal effect.
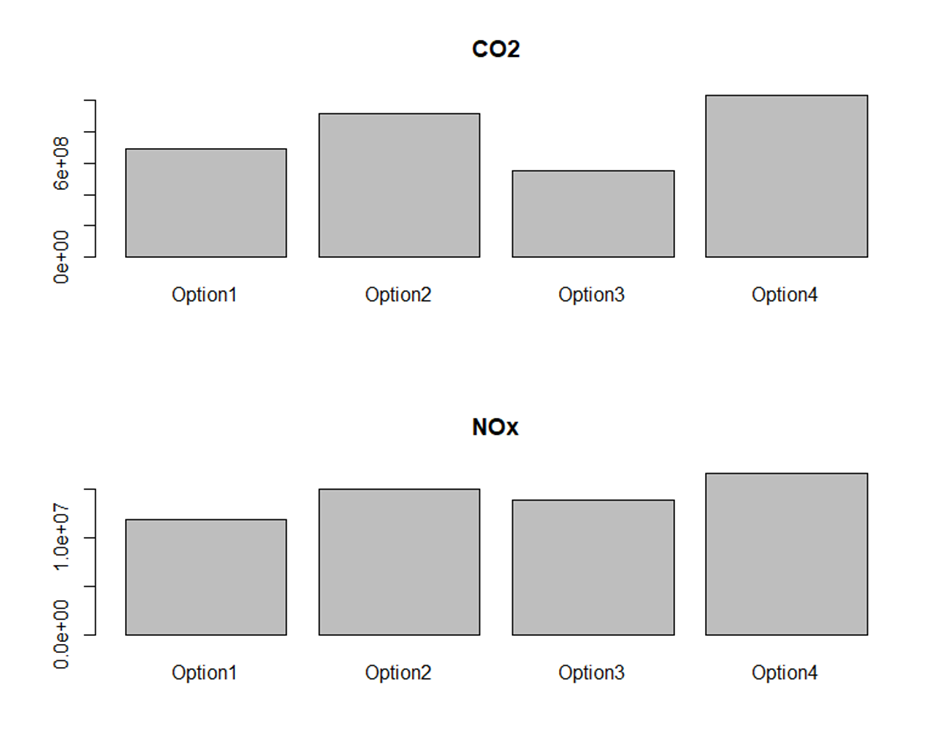
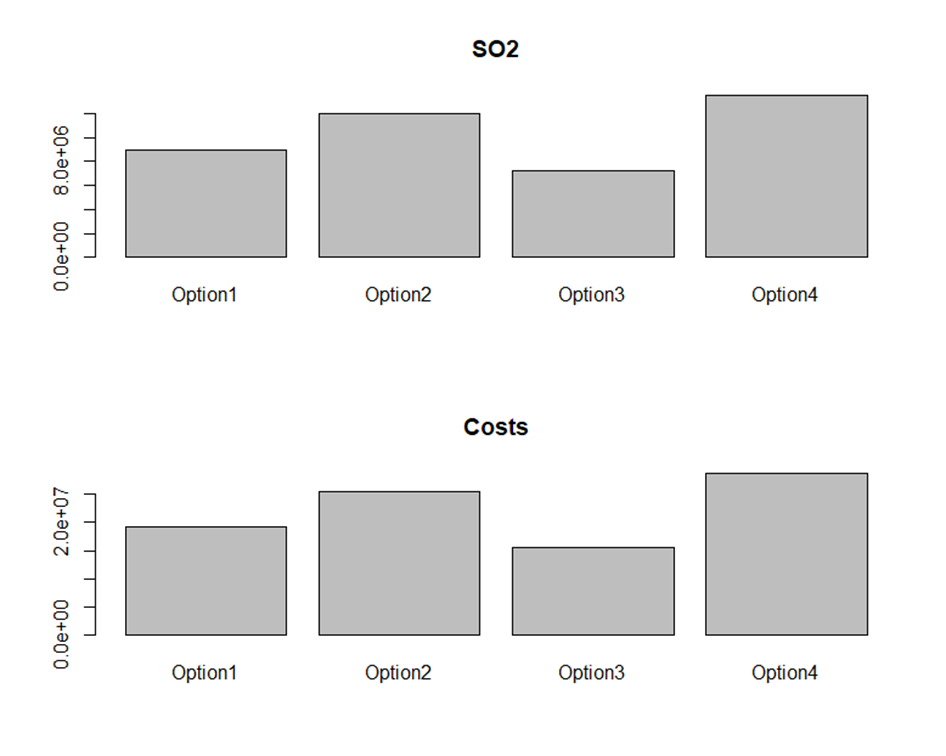
Image 2 Box Plot – Life Cycle Inventory Analysis
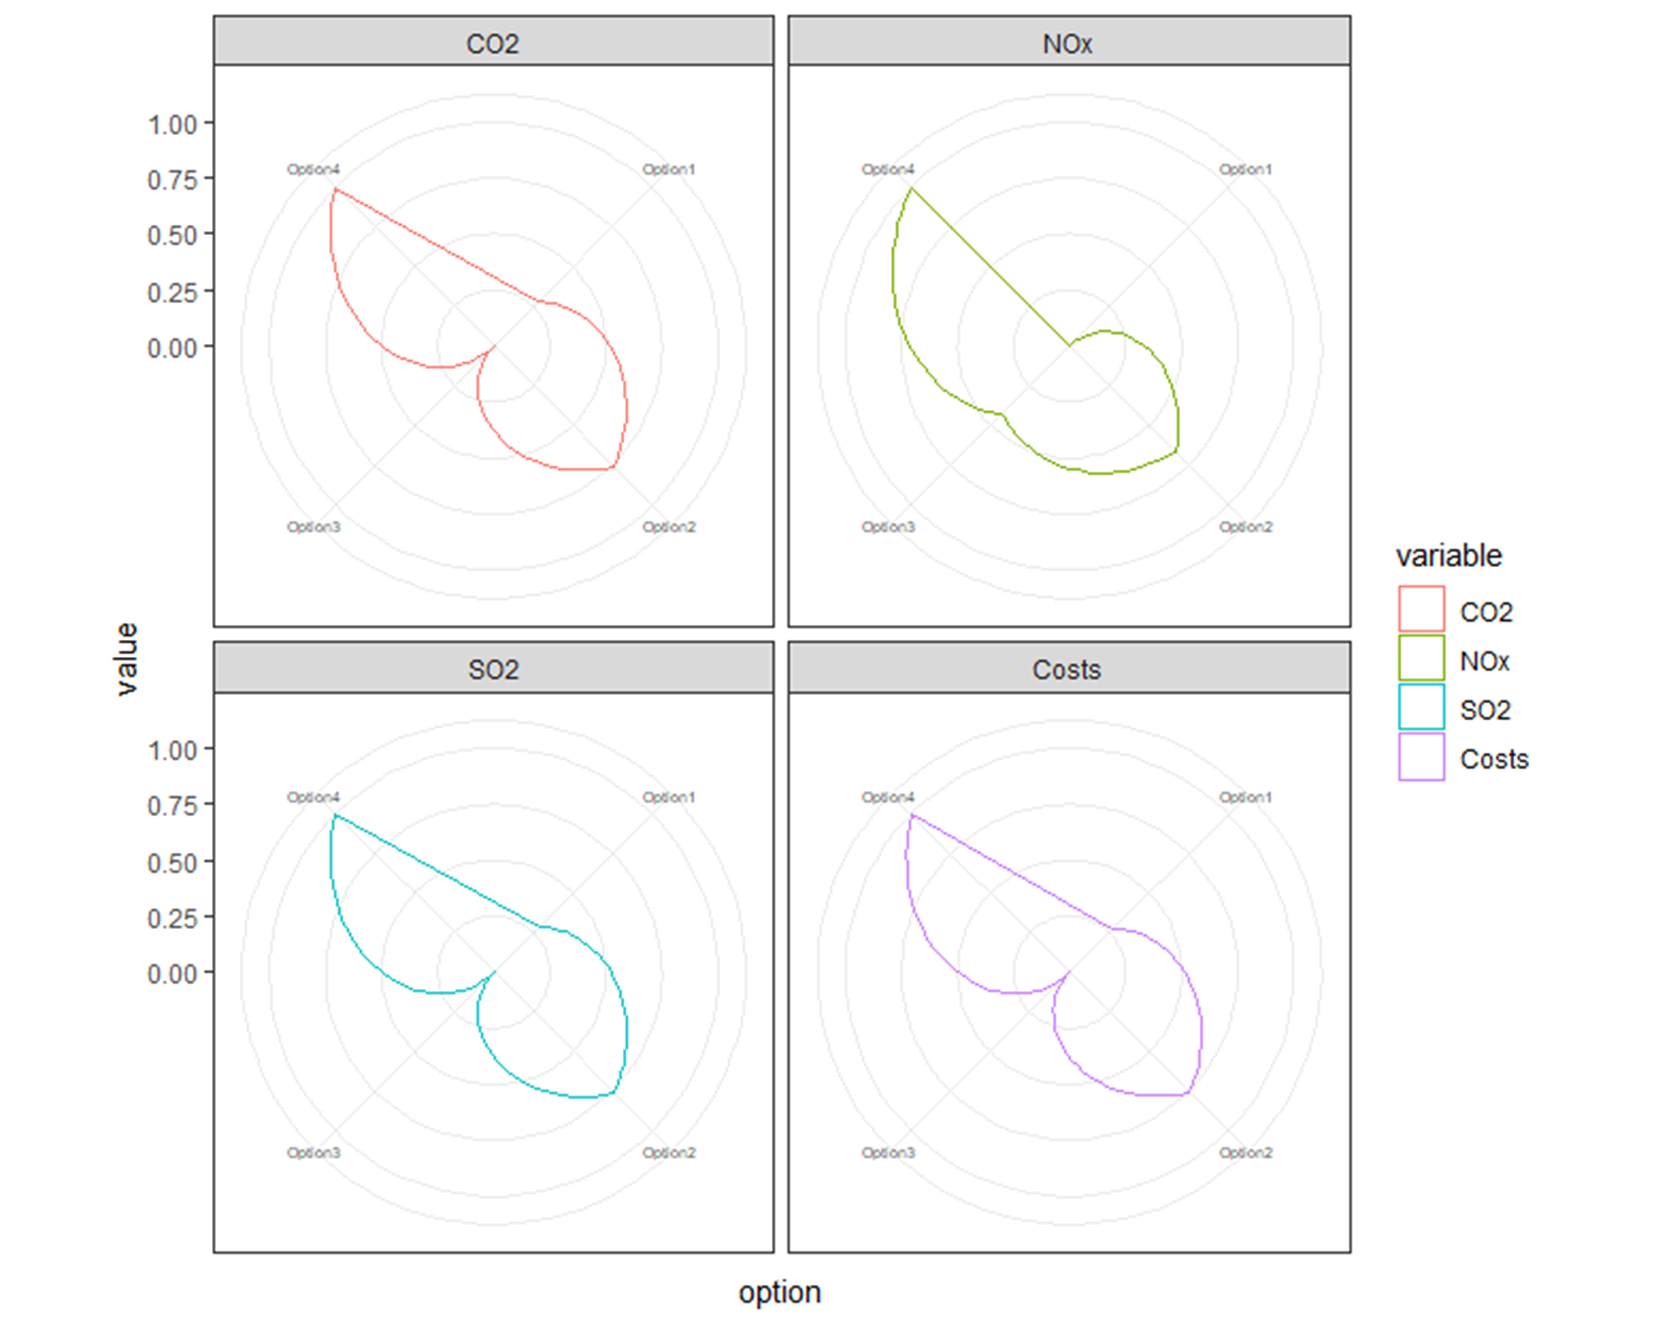
Image 3 Radar Plot – Life Cycle Inventory Analysis
The three systems tram track, tunnel and bicycle underpass could be combined into a Local Network System. The possibilities in optimizing the efficiency of the maintenance period by combining measures and the appropriate selection of materials has highlighted the potential of a life cycle analysis. In particular, measures for underpasses could be combined in terms of timing and logistics, saving effort and cost. However, the tram track is difficult to see in combination, as they are very different in terms of components and materials, as well as methods of repair.
It would be interesting, for example, in further work to compare them to other overpass and underpass systems, such as a bridge.