The time interval of intervention for each maintenance system is assumed to be compatible with the integrated system. Then the subsystems have been integrated to calculate the combined lifetime and intervention based on the timeline. The frequencies of each maintenance are collected and integrated into the system. The common domain of all systems is determined and prescribed as the main domain for the integrated function. Afterward, the lifetime of the integrated system is determined as 70 years. The objective is to calculate NOX, SO2, CO2, energy consumption, and cost. The objective for the service level of the integrated system is to decrease minimum time intervention.
Results:
![]()
MAINTENANCE STRATEGY (Integrated system)
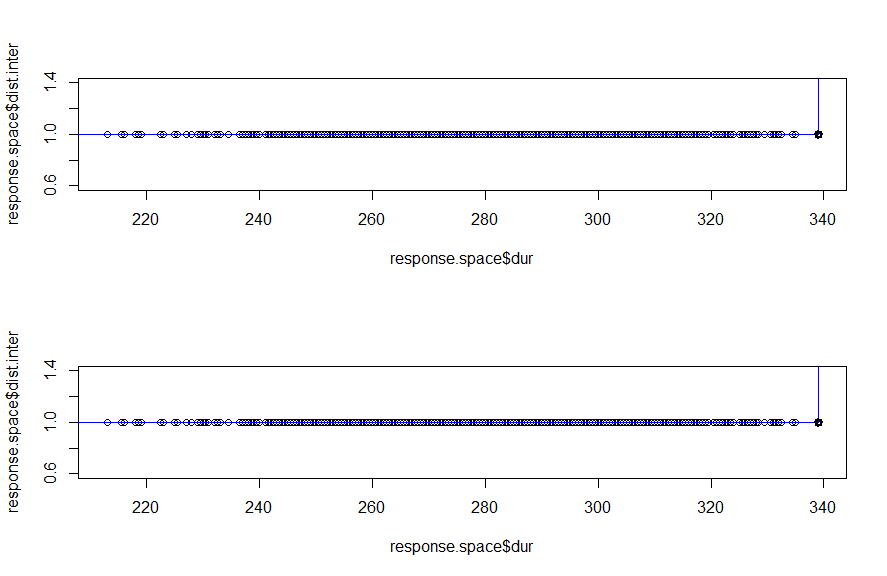
The first thing done here was to combine the lifetimes of all our systems, the Bridge, Building, Metro station, and wastewater distribution system. We then simulated the system and got 119 days as our total intervention, given that our defined lifetime for the integrated system was 70 years. This depicts and shows the wide range of differences between our individual systems.
Putting into consideration the substantial effects the interventions will have on each of our systems, the duration for the intervention gotten, which was 119 days, was considered the most suitable for our integrated system, without using the multi-objective optimization.
LIFE CYCLE ANALYSIS (Integrated system)
(METRO STATTION)
events.grid.metro <- expand.grid(RR.m = sample(seq(20,30, by = 1), n.grid),
M.m = sample(seq(3,8,1), n.grid),
FER.m = sample(seq(12, 20, 1), n.grid),
CS.m = sample(seq(45, 58, 1), n.grid))
(BRIDGE)
events.grid.bridge <- expand.grid(SDO.b = sample(seq(12, 25, by = 1), n.grid),
M.b = sample(seq(3,10,1), n.grid),
DR.b = sample(seq(28,45,1), n.grid))
(BUILDING)
events.grid.building <- expand.grid(SDR.bu = sample(seq(10,20, by = 1), n.grid),
M.bu = sample(seq(6,16,1), n.grid),
DR.bu = sample(seq(44, 55, 1), n.grid))
(WASTE WATER PLANT)
events.grid.water <- expand.grid(PI.w = sample(seq(5, 14, by = 1), n.grid),
M.w = sample(seq(10,21,1), n.grid),
PR.w = sample(seq(48, 60, 1), n.grid))