LCA & MCDA
The essay provides nine design options and discusses their lifecycle inventories based on the adopted quantities of materials respectively.
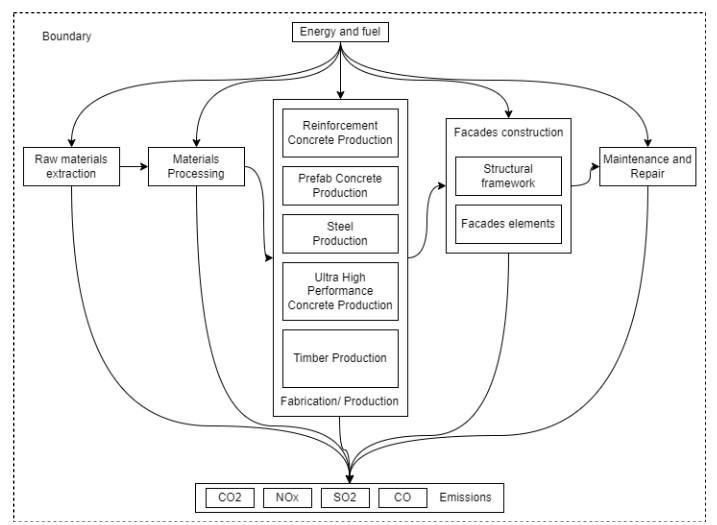
The below figure shows the system scope and boundary of a building façade:
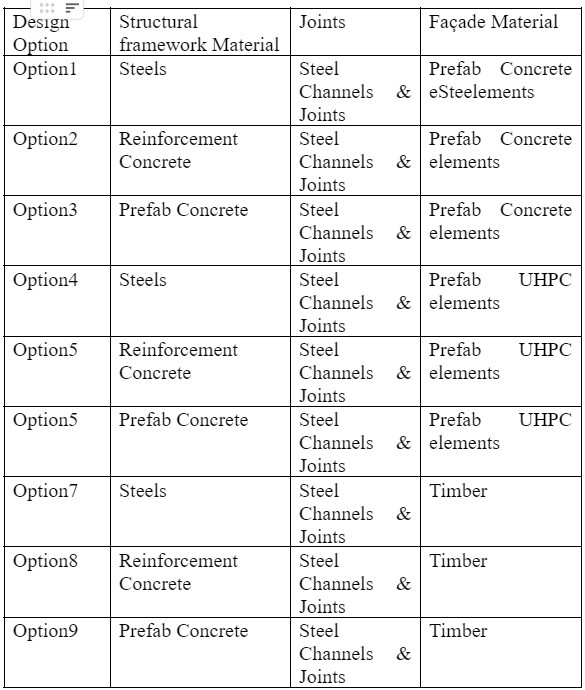
The below table represents different design options for the facade system:
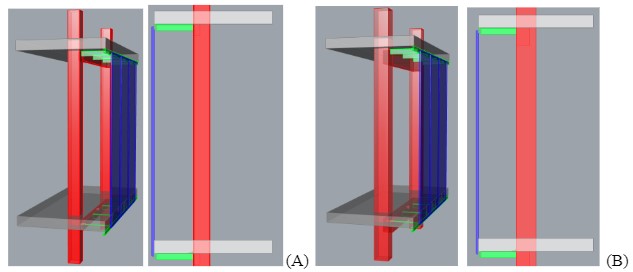
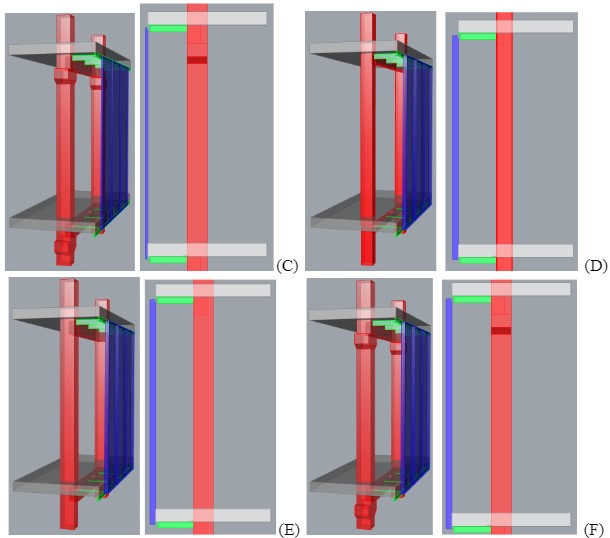
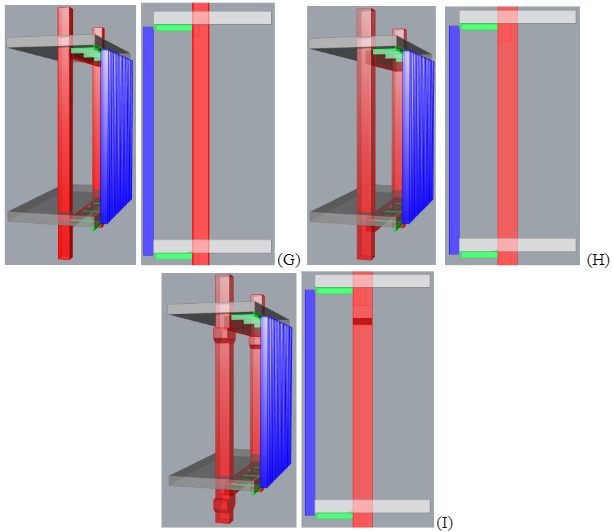
The below figures represent the perspective images and sections of facade options:
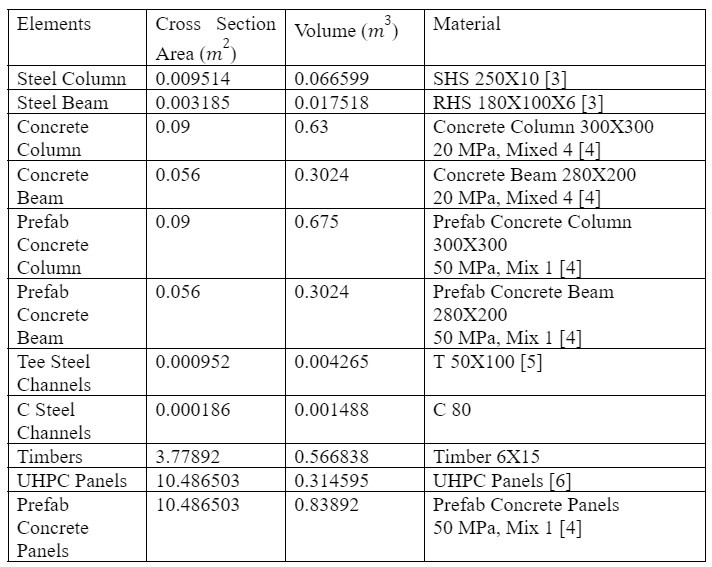
The below table represents the section area and volume of each element:
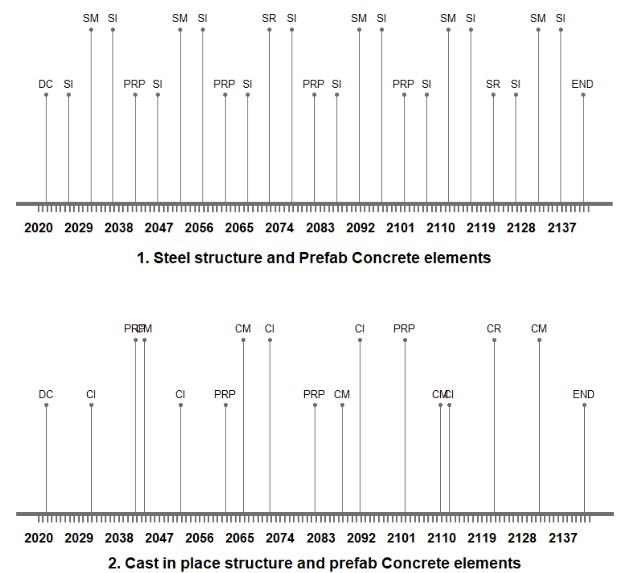
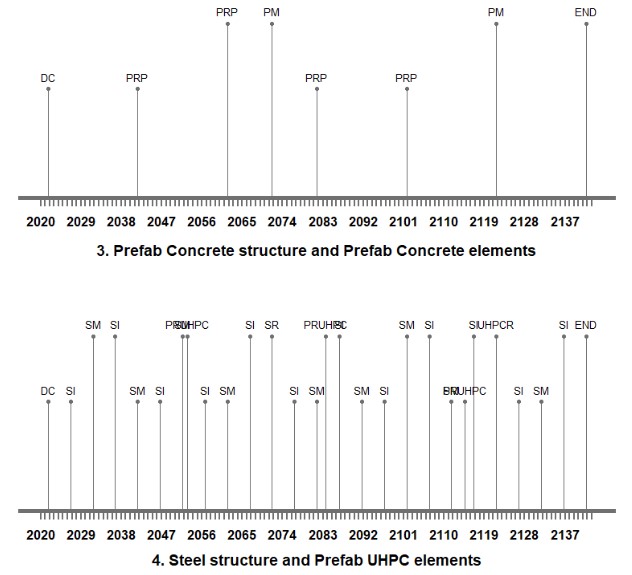
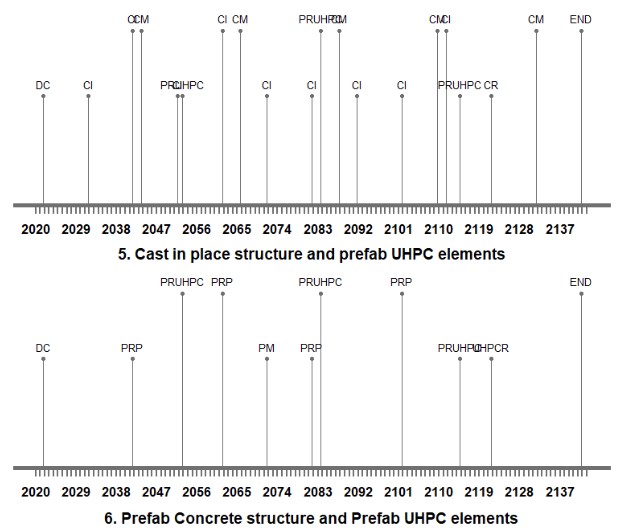
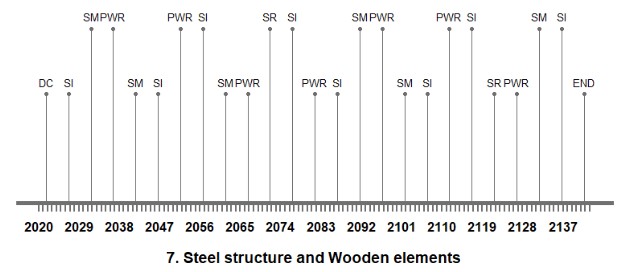
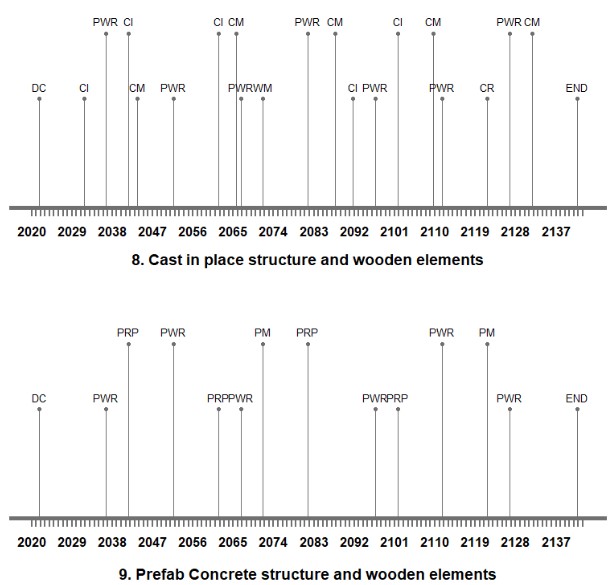
Life Cycle Timeline: The steel structure maintenance interval is ten years (SM). Then, the end of life tends to be 50 years for an office building [11], which means that the steel structure needs to be replaced each half a century (SR). Subsequently, concrete structure maintenance highly depends on the current condition and environmental issues. Averagely, the maintenance of concrete structures is around 20 to 25 years (CM) , in this study I set in 22 years, and the lifetime is set at approximately 100 years [13]–[15] (CR). Then, the inspection interval for concrete structures is every ten years (CI). Moreover, prefab concrete pavements, for example, are recommended to be placed every 40 to 50 years [16]. Therefore, in this study, I shall assume that the prefab concrete panels need to be partially replaced every 20 years (PRP), and the prefab concrete structural framework needs to be maintained every 50 years (PR). Besides, the UHPC panel maintenance interval is 31 years (PRUHPC), also after about 100 years, the UHPC corrosion reaches about 70% [6]; hence, I shall expect that UHPC elements service life is 100 years (UHPCR). The service life for wooden buildings is around 50 years [17]; this essay, therefore, assumes that the timber maintenance interval is 50 years (WM) and the partial replacement is 15 years (PWR).
The below figure represents the distribution of maintenance and replacement within 120 years for the nine options:
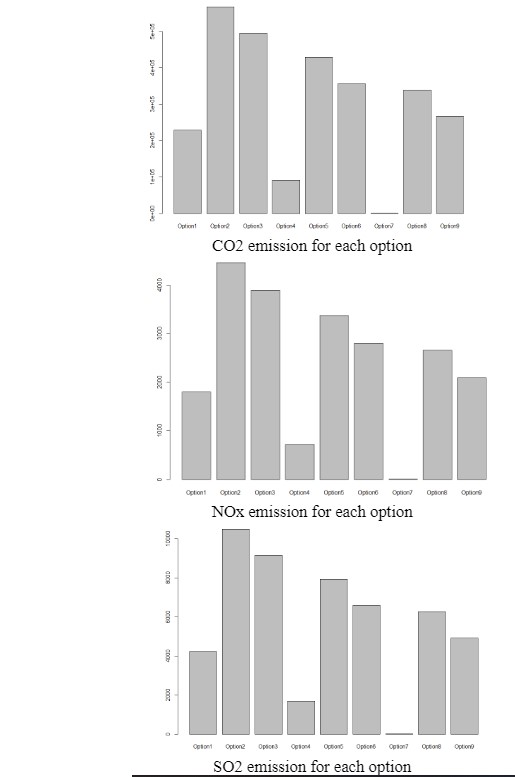
Life Cycle Inventory: According to tables 5 and 6, the below bar charts show the comparison of energy consumption, CO2, NOx, SO2, and CO, respectively, between each option:
MCDA:
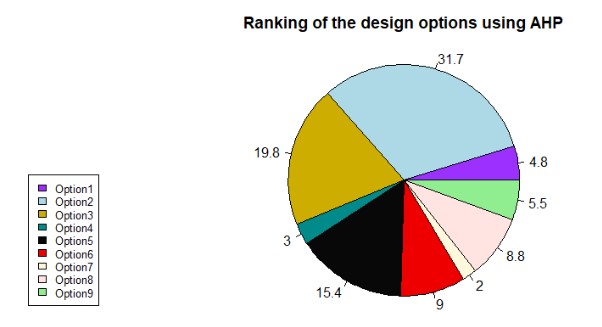
- AHP:
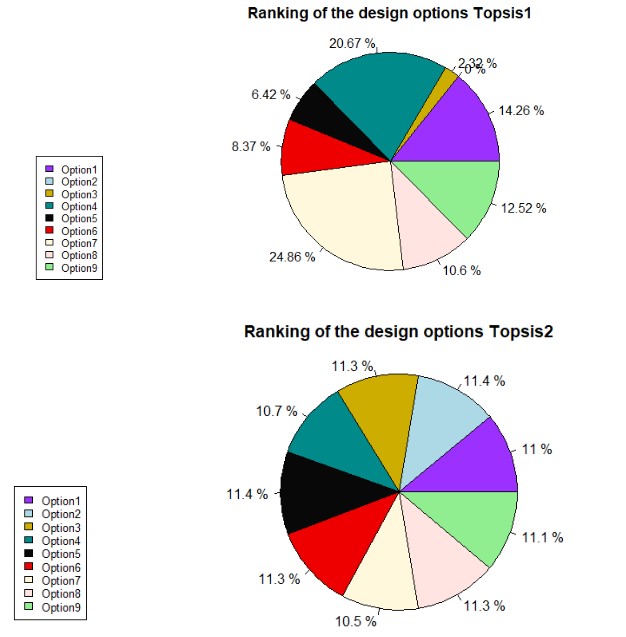
- TOPSIS:
Other Systems: