1- Introduction
This assignment comprises several key sections.
Initially, I outline the study’s goal and scope. This will contain the specific components under examination, my interpretation of available data and an overview of the three design options.
Following this, a life cycle timeline is presented, capturing maintenance activities and the total lifetime for each design alternative. Subsequently, I conduct an impact assessment for each option. Here I will also shortly discuss the chosen performance criteria. Moving forward I performed a multi-criteria analysis using the Analytic Hierarchy Process. Finally, I draw conclusions based on the results, concluding with a discussion that provides
an alternative perspective on the findings. The analysis in this study is performed using Rstudio.
2- Goal and Scope
Berlin has the goal to become a “Sponge City” (Mulke, 2021) and for that reason, two design options of permeable pavements are compared with each other in a conventional pavement type. These pavements allow water to run through the pavement’s surface layer, which helps optimize stormwater control, less spray on the road, and more water collection in the city. In the figure below (Figure 1) three design options are represented with their respective dimensions.
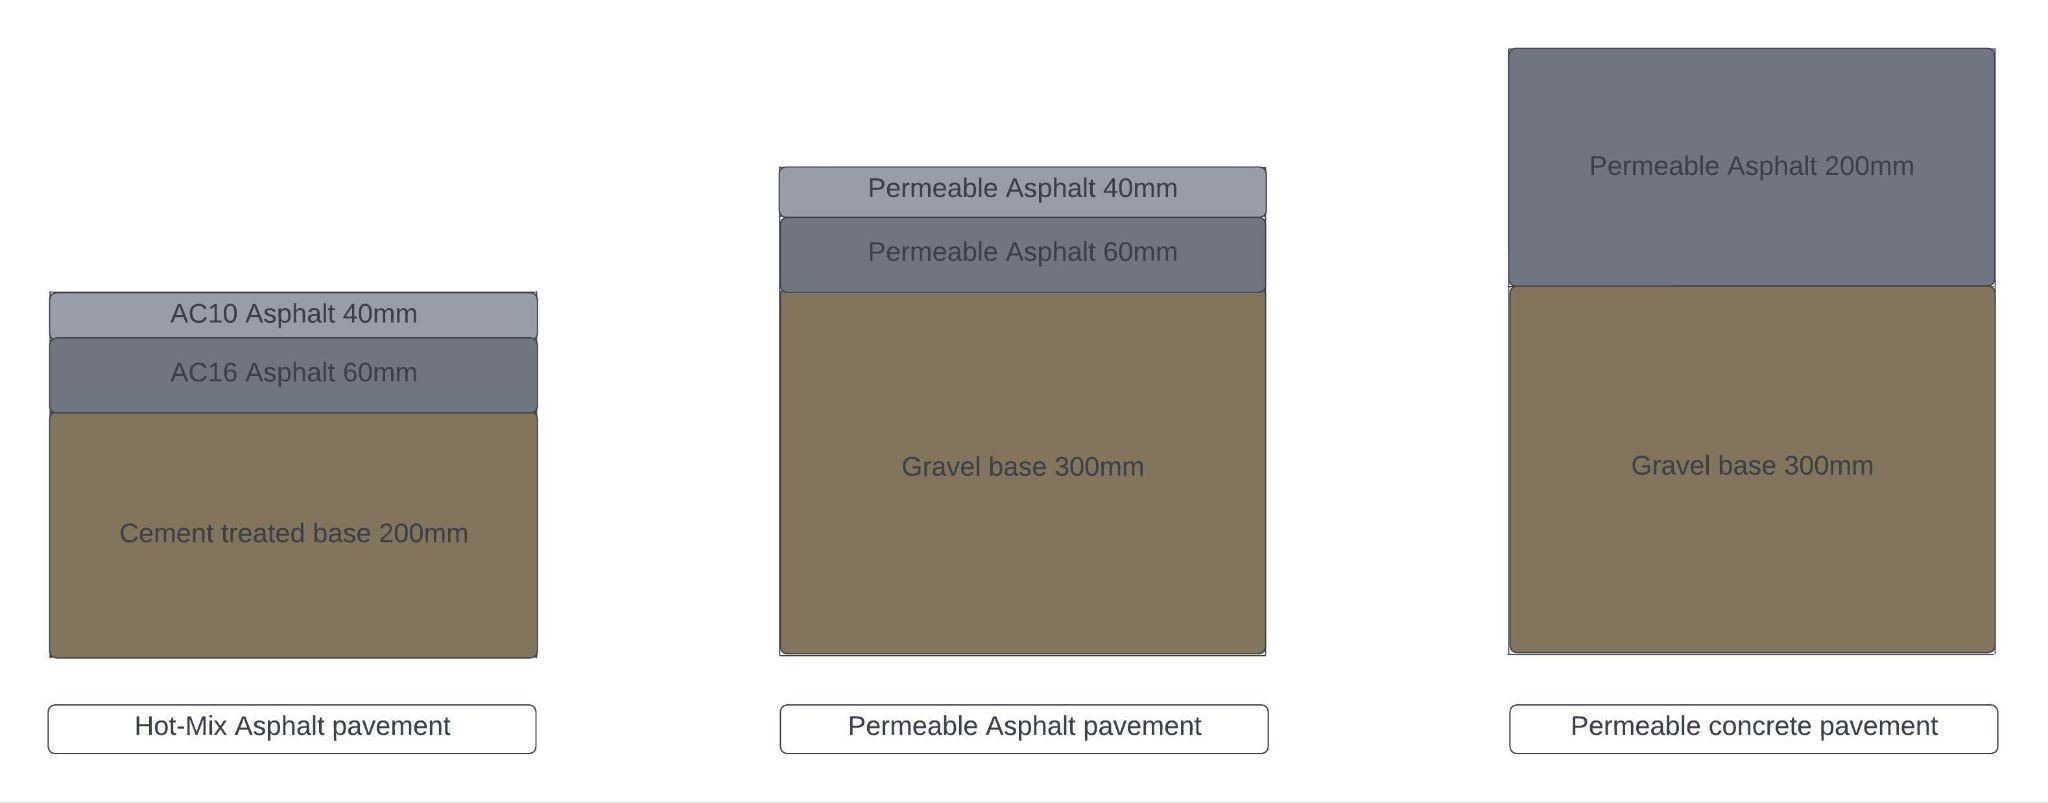
Figure 1: Design alternatives of LCA study
The exact design alternatives are Hot-Mix asphalt pavement (HMA), Permeable Asphalt pavement (PA), and Permeable concrete pavement (PC).
Scope
The figure below depicts the project’s scope, focusing on evaluating the impact of each design alternative during the Cradle-to-Operation phase of the life cycle. Detailed information on each scope component will be elaborated in the subsequent Life Cycle Inventory (LCI).
Maintenance of the road has been incorporated into this study by incorporating the impacts of construction and additional materials required for maintenance procedures throughout its entire lifetime.
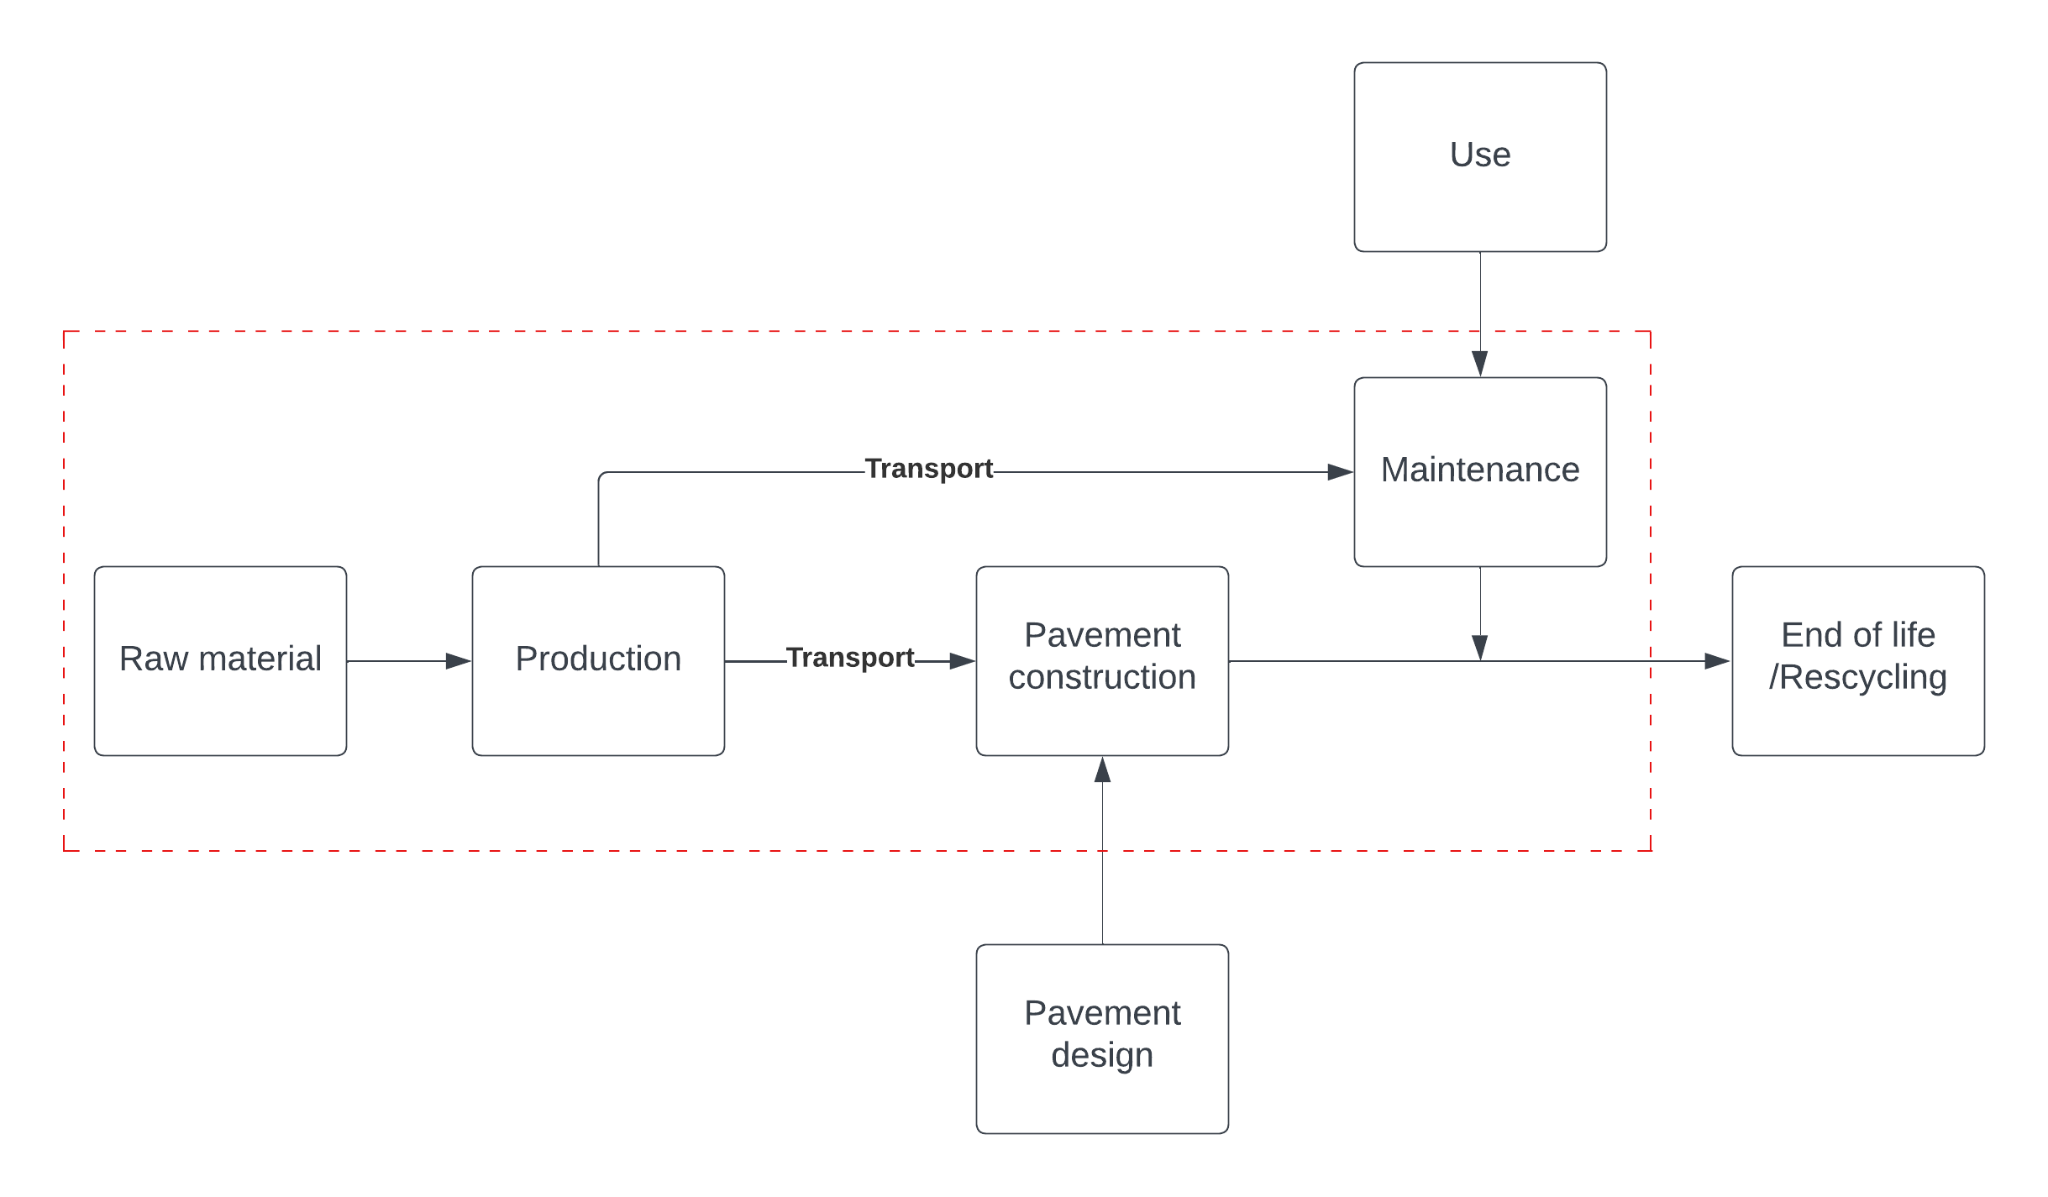
Figure 2: Illustration of LCA scope
The comparative Life Cycle Assessment (LCA) for our study has strategically excluded certain phases to streamline complexity. The design phase, encompassing activities such as engineers commuting and attending meetings, has been omitted due to the anticipation of limited variations among alternatives in this subsystem. Additionally, the use-phase, involving emissions from cars on the road, has been excluded. To further simplify the
analysis, considerations related to End-of-Life and recycling aspects have been omitted. The primary focus of our study is on the production and construction phases of the pavement life cycle, deliberately excluding the usage phase from our analysis.
3- Life Cycle Inventory (LCI) analysis
To derive the results, I amalgamated data from various papers, occasionally combining values based on contextual relevance. Subsequently, I standardized the values for each component to represent 1 square meter. Before entering the maintenance phase, I calculated the sum of components for each layer. In the R-script, I defined the square meters for each layer and multiplied them by the corresponding values per square meter.
Raw materials
I combined bitumen production values from (The European Bitumen Association, 2020) with gravel production values from (Aman, 2022) for HMA. For PC, I exclusively relied on the data from table 3 in ‘Comparative life cycle assessment of pervious concrete production in Malaysia with natural and recycled aggregate’ (Aman, 2022). Likewise, for PA, I utilized the complete set of values from table 2 in ‘Comparative Life Cycle Assessment (LCA) of Porous
Asphalt Mixtures with Sustainable and Recycled Materials: A Cradle-to-Gate Approach’ (De Pascale, 2023).
Production of component mixtures I derived the impact values for HMA and PA from the asphalt mixing mixture in table 3 of (Ma, 2019). Similarly, for PC, I exclusively utilized the data from table 3 in ‘Comparative life cycle assessment of pervious concrete production in Malaysia with natural and recycled
aggregate’ (Aman, 2022).
Transportation
I utilized the ton per km value from (Aman, 2022) to convert the impact per square meter. Assuming a travel distance of 20 kilometers for each option and considering medium-sized trucks with a loading capacity of 3500 kilograms, these parameters were applied in the
conversion process.
Construction and Maintenance
While assuming the construction impact to be consistent across all design alternatives, the distinctions in their environmental impact emerge through variations in maintenance procedure frequencies over the alternatives’ lifetimes. For resurfacing, I assumed an impact equivalent to construction. Similarly, the impact of patching was assumed to be identical to construction but adjusted by the percentage of road patches, as outlined in Table 2 and 3 of the source ‘Integrated life cycle assessment of permeable pavement: Model development and case study’ (Liu, 2020). Detailed information on individual maintenance procedures can be found in the Life-Cycle timeline.
4- Life-cycle timeline
To determine the Life-Cycle timeline of each design option I used table 2 and 3 of ‘Integrated life cycle assessment of permeable pavement: Model development and case study’ (Liu, 2020) represented in figure 3. I named micro-surfacing: Sealing, and i named Surface milling: patch repair.
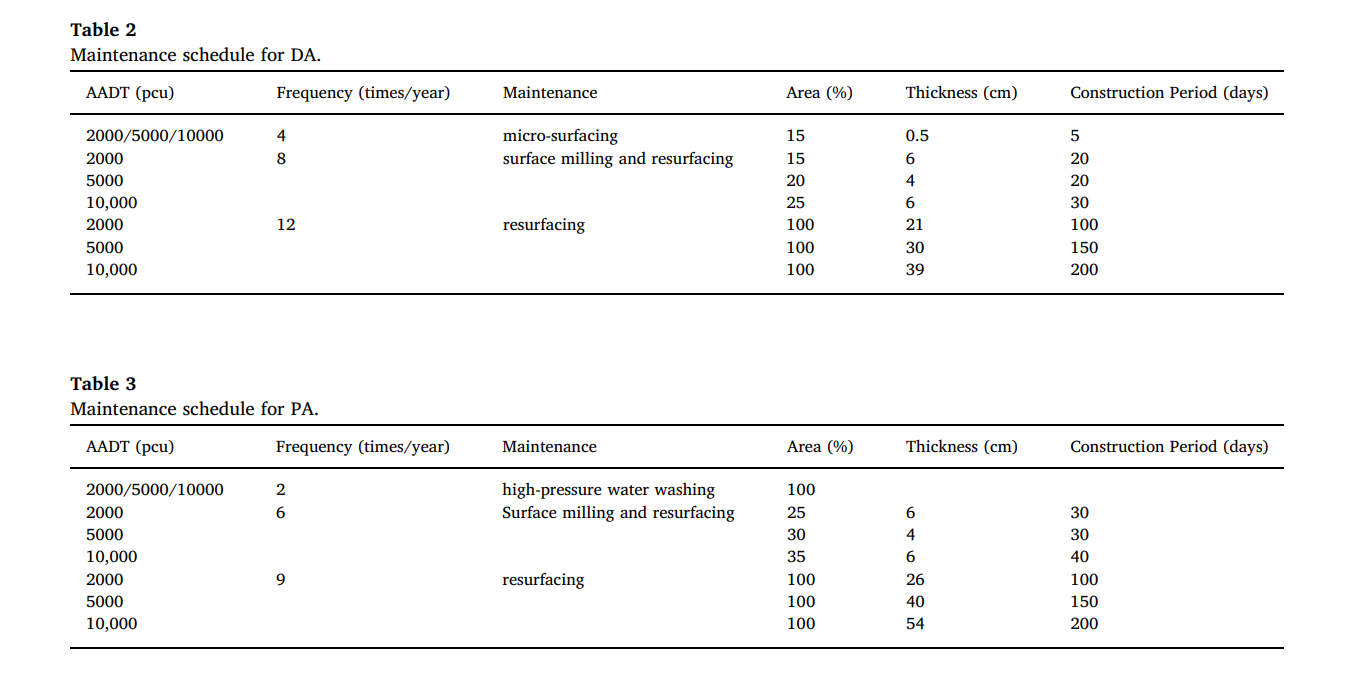
Figure 3: ‘Integrated life cycle assessment of permeable pavement: Model development and case study’ (Liu, 2020)
Life-cycle timelines for HMA, PC, and PA are visualized in figures 4, 5, and 6, respectively. Repair frequencies for HMA were extracted from table 2 in figure 3, assuming a total lifetime of 30 years. PC’s values were interpolated between tables 2 and 3 in figure 3, considering its durability between HMA and PA, and assumed a total lifetime of 25 years. PA’s values were sourced from table 3 in figure 3, with a total assumed lifetime of 20 years.
Inspections are included in the Life-Cycle timeline for all options but are not factored into the impact calculations. Additionally, annual pressure washing of the surface is included in the Life-Cycle timeline for both PC and PA but is excluded from the impact calculations.
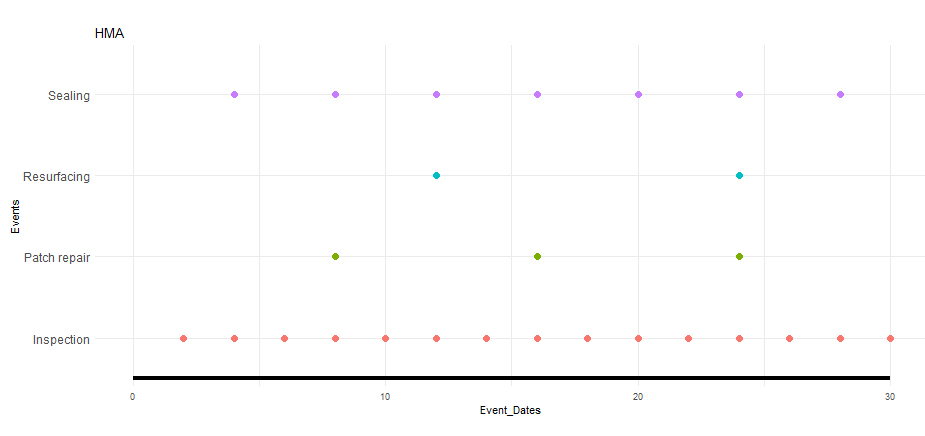
Figure 4: Maintenance lifetime of HMA
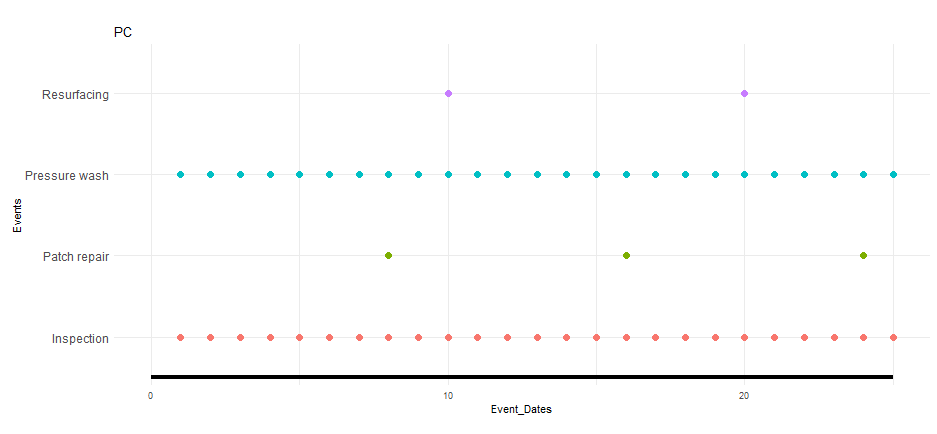

Figures 5 & 6: Maintenance lifetime of PC & PA
5- Life Cycle Impact Assessment
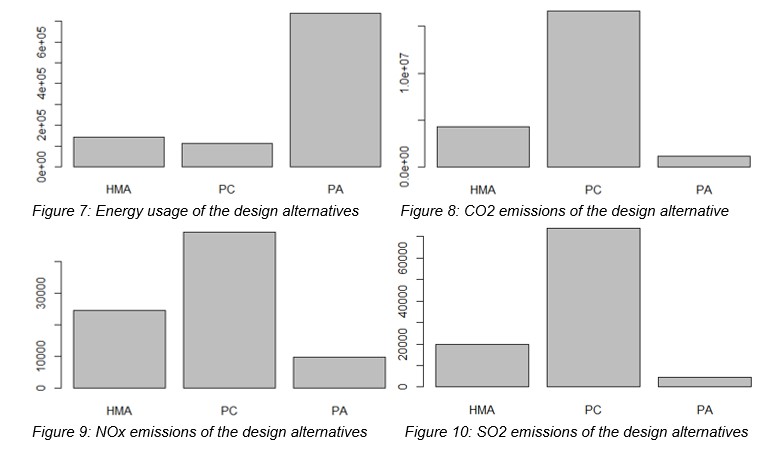
The study results are summarized in Table 1. Notably, PA exhibits relatively low scores across all factors except for energy usage. In contrast, PC scores high on all factors except energy usage, possibly attributed to concrete’s substantial weight and the environmental impact of cement production, a key component in concrete. HMA falls between PA and PC in most values but closely aligns with PC in terms of energy usage. Comparative bar charts illustrating these findings are presented in Figures 7, 8, 9, and 10.
| Performance criteria | HMA | PC | PA |
| Mj (Fu) | 143138.6 | 111949.4 | 736644.9 |
| CO2 (Kg/Fu) | 4324507 | 16616286 | 1173019 |
| NOx (Kg/Fu) | 24605.12 | 49238.74 | 9729.34 |
| SO2 (KgFu) | 19991.06 | 73810.98 | 4549.44 |
Table 1: Results of design options
6- Analytic Hierarchy Process (AHP)
A multi-criteria decision-making strategy, specifically the Analytic Hierarchy Process (AHP), was employed to facilitate the decision-making process. In this method, the results for each performance criterion are compared using a ‘Saaty-score,’ establishing the subjective weight of one value relative to another. The
determination of Saaty-scores through value comparisons is outlined in Table 2, while Table 3 illustrates the matrices for each performance criterion after applying the logic from Table 2 to the results.
| Difference (%) of two performance criteria | Saaty Score |
| 0% < X < 10% | 1 |
| 10% < X < 20% | 2 |
| 20% < X < 30% | 3 |
| 30% < X < 40% | 4 |
| 40% < X < 50% | 5 |
| 50% < X < 60% | 6 |
| 60% < X < 80% | 7 |
| 80% < X < 90% | 8 |
| 90% < X < 100% | 9 |
Table 2: Ranking logic of alternatives
| Mj | HMA | PC | PA | CO2 | HMA | PC | PA | NOx | HMA | PC | PA | SO2 | HMA | PC | PA |
| HMA | 1 | 1/3 | 8 | HMA | 1 | 7 | 1/7 | HMA | 1 | 6 | 1/7 | HMA | 1 | 7 | 1/7 |
| PC | 3 | 1 | 8 | PC | 1/7 | 1 | 1/9 | PC | 1/6 | 1 | 1/8 | PC | 1/7 | 1 | 1/9 |
| PA | 1/8 | 1/8 | 1 | PA | 7 | 9 | 1 | PA | 7 | 8 | 1 | PA | 7 | 9 | 1 |
Table 3: Matrixes of each performance criterion.
I assigned equal importance to energy usage (Mj) and Carbon dioxide (CO2) emissions, recognizing the substantial influence of energy consumption on CO2, especially through fossil fuels. As a secondary priority, Nitrous oxide (NOx) was chosen due to its current high levels, impacting both human health and the environment (AccuWeather, Inc., 2024). As indicated in the same source, Sulfur dioxide (SO2) levels are presently within acceptable limits, rendering it the least influential factor in this study. The priority matrix is detailed in Table 4.
| Mj | CO2 | NOx | SO2 | |
| Mj | 1 | 1 | 3 | 5 |
| CO2 | 1 | 1 | 3 | 5 |
| NOx | 1/3 | 1/3 | 1 | 3 |
| SO2 | 1/5 | 1/5 | 1/3 | 1 |
Table 4: Design-criteria priority matrix
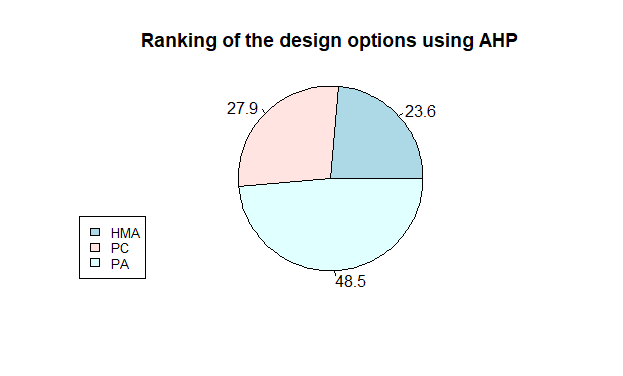
Figure 11: End result AHP-analysis
7- Conclusion and Discussion
Examining the results presented in figure 11, it becomes evident that Permeable Asphalt (PA) stands out as the preferred option among the three pavement designs. Despite its relatively higher score in energy usage, PA outperforms in all other environmental impact criteria, making it the least detrimental to the environment according to the study’s performance criteria.
While the results point to Permeable Asphalt (PA) as the environmentally preferable option, it is essential to acknowledge certain considerations that may impact the robustness of these findings. The amalgamation of data from various studies introduces a potential for distortion in the representation of the results. Each study may have unique methodologies, sources, and contexts, which could influence the comparability and accuracy of the combined data.
Moreover, the reliance on assumptions during the construction and maintenance phases introduces an additional layer of complexity. Assumptions, by nature, simplify real-world scenarios and can potentially affect the accuracy of the life cycle analysis. Factors such as variations in construction practices, material sources, and maintenance procedures could contribute to uncertainties in the environmental impact assessment.
In conclusion, while Permeable Asphalt (PA) emerges as the environmentally preferable option based on the available data and analysis, the study underscores the need for continuous refinement and validation of methodologies to ensure the accuracy and reliability of life cycle assessments in infrastructure decision-making.
References
● Wolfgang Mulke, (November 2021), RAIN HAS BECOME A HIGHLY
SOUGHT-AFTER COMMODITY,
https://www.goethe.de/ins/us/en/kul/wir/22519905.html#:~:text=Berlin%20wants%20t
o%20become%20a,the%20sustainable%20use%20of%20rainwater
● Aan Mohammad Nusrat Aman, (8 April 2022), Comparative life cycle assessment of
pervious concrete production in Malaysia with natural and recycled aggregate
● Jiawen Liu, (16 June 2020), Integrated life cycle assessment of permeable
pavement: Model development and case study
● The European Bitumen Association, (April 2020), THE EUROBITUME LIFE-CYCLE
INVENTORY FOR BITUMEN VERSION 3.1
● Beatrice De Pascale, (3 October 2023), Comparative Life Cycle Assessment (LCA)
of Porous Asphalt Mixtures with Sustainable and Recycled Materials: A
Cradle-to-Gate Approach
● Hui Ma, (19 September 2019), A Comparative Life Cycle Assessment (LCA) of
Warm Mix Asphalt (WMA) and Hot Mix Asphalt (HMA) Pavement: A Case Study in
China
● Gregory E. Halsted, 2006, Guide to Cement-Treated Base (CTB)