In the realm of infrastructure development and management, the efficacy of maintenance strategies holds paramount importance. As stewards of urban systems and construction projects, it becomes imperative to understand, assess, and optimize maintenance practices to ensure the longevity, functionality, and sustainability of assets. This assignment delves into the intricate interplay between maintenance strategies and life cycle analysis (LCA) within the context of urban infrastructure systems.
Maintenance Strategy
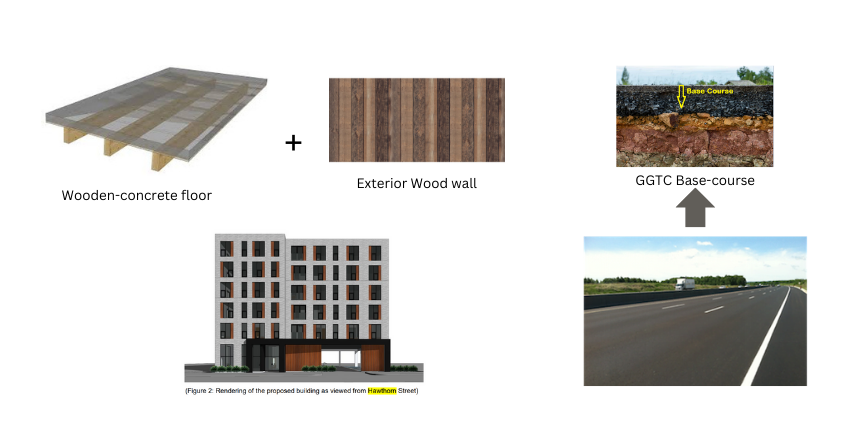
In our initial model, we delineated three distinct subsystems: the Timber-concrete floor, Exterior wood wall, and Base GGTC. However, to enhance model simplicity and realism while maintaining practicality, we devised a strategic amalgamation. This involved consolidating the Timber-concrete floor and Exterior wood wall into a unified entity termed the ‘Wood System.’
Individual Strategy
Individual maintenance strategies for subsystems within urban infrastructure systems are crucial for ensuring the longevity, functionality, and safety of essential components. Tailored interventions address specific needs, mitigate risks, and optimize asset performance, thereby minimizing downtime, enhancing operational efficiency, and safeguarding public safety.
The amalgamation of the Timber-concrete floor and Exterior wood wall into the unified ‘Wood System’ presents a notable reduction in the number of interventions required compared to the sum of separate subsystems. This consolidation not only simplifies maintenance planning and execution but also optimizes resource allocation, resulting in fewer interruptions and lower overall maintenance costs.
| Subsystem | Intervention | Abbreviation | Interval (years) | Interruption (days) | Years |
| Wood System | Sealing and Coating | Sc.w | 4 | 10 | |
| Moisture and damage inspection | MDI.w | 1 | 1 | 60 | |
| Fireproofing measures | FM.w | 5 | 5 | ||
| Structural measures | SM.w | 5 | 5 | ||
| Base GGTC | Routine Maintenance | RM.p | 20 | 3 | 20 |
| Resurfacing | R.p | 2 | 10 | ||
| Major Repairs | MR.p | 2 | 20 |
Subsystem Intervention, Frequency, duration and life time
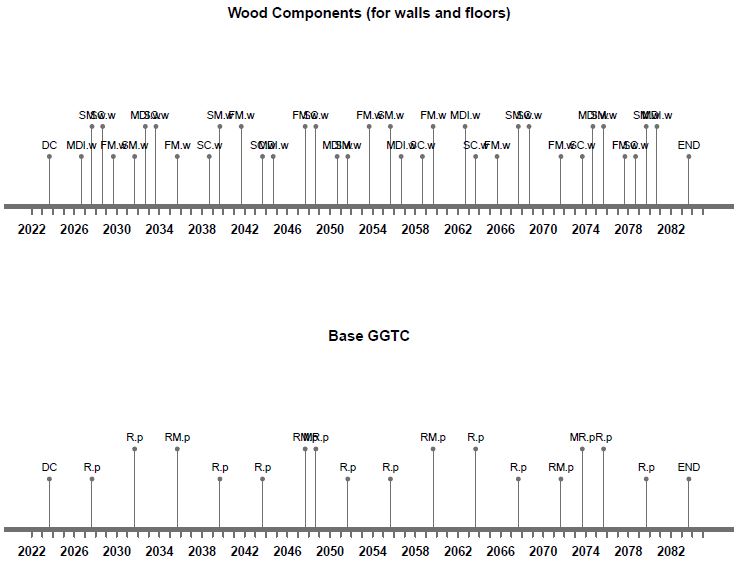
Maintenance Strategies for Wood system and Base GGTC
Integrated Maintenace Strategy
Efficient maintenance planning for systems comprising multiple subsystems is crucial for ensuring seamless operation and minimizing disruptions.
In this phase of the analysis, our focus is on optimizing maintenance actions by bundling interventions across subsystems to minimize the total duration of interventions over the system’s lifetime. To achieve this, we have re-defined a range of years within which each intervention for each subsystem can take place, along with the duration of each maintenance action in days.
| Subsystem | Intervention | Abbreviation | Interval (years) | Interruption (days) |
| Wood System | Sealing and Coating | Sc.w | 5 | 12 |
| Moisture and damage inspection | MDI.w | 3 | 3 | |
| Fireproofing measures | FM.w | 6 | 4 | |
| Structural measures | SM.w | 4 | 7 | |
| Base GGTC | Routine Maintenance | RM.p | 12 | 5 |
| Resurfacing | R.p | 4 | 2 | |
| Major Repairs | MR.p | 25 | 15 |
Subsystem Re-defined Intervention, Frequency, duration and life time
Results
In the visualization presented below, a notable phenomenon emerges through the exploration of a complex dataset comprising 142 distinct groups. Through a scatter plot generated using ggplot2, the relationship between two variables, namely “dur” and “dist.inter,” is depicted. The plot unveils intriguing insights into the interplay between these variables across the multitude of groups encapsulated within the dataset. Each group is assigned a unique color, facilitating visual distinction and allowing for the identification of patterns or trends specific to individual groups.
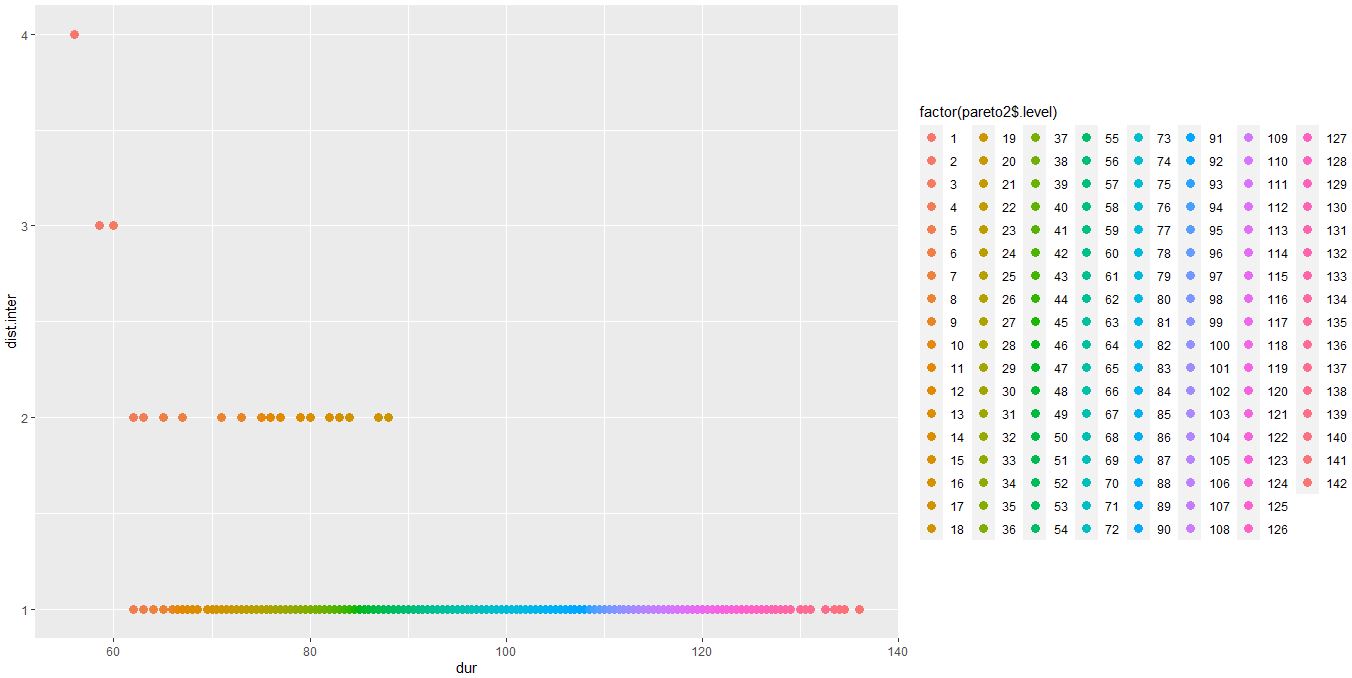
Colour-based Alternatives ranking
Although, we know the color of the highest rated alternatives, but at this point it is difficult to identify these. A good way to improve the graphical representation is to make use of Pareto Frontier.
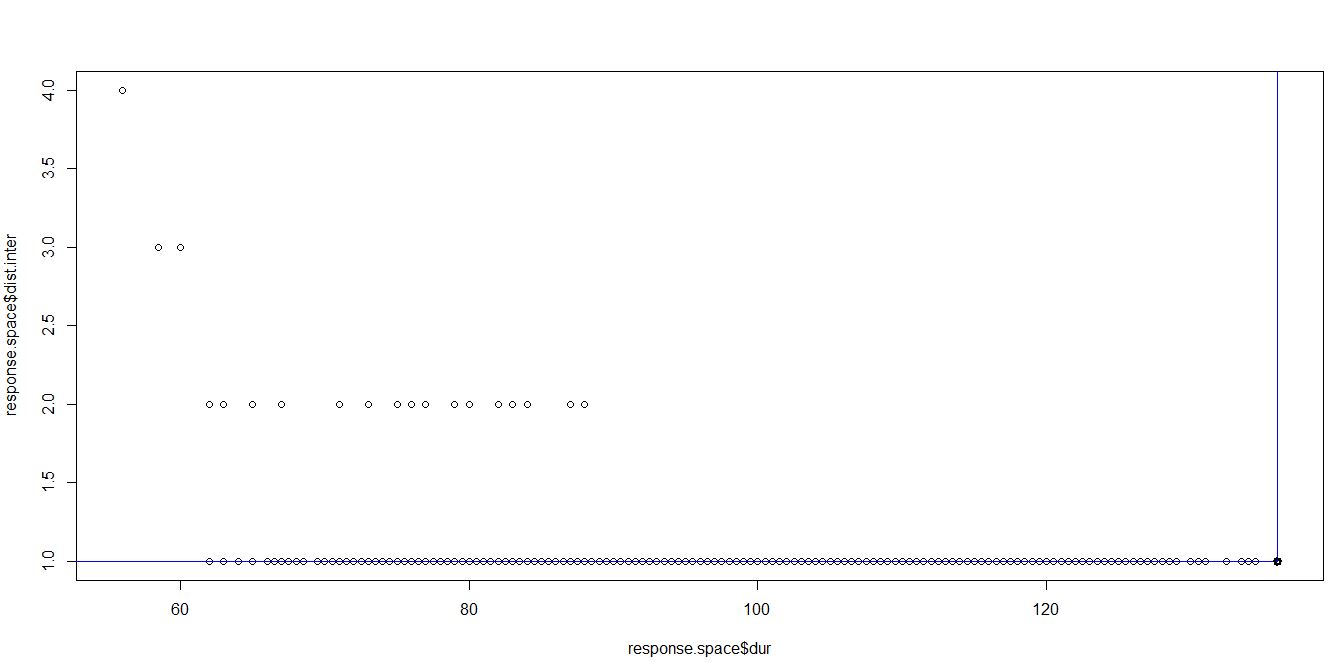
As we analyze the above figure, we see the best design option minimizing downtime and maximizing the time between interventions. In the result plot, the blue lines depict the Pareto frontier, delineating the boundary between Pareto-efficient solutions and suboptimal ones. The black dots on the plot signify the optimal combinations of lifetime scenarios. These points represent solutions characterized by minimal intervention duration and maximum time between interventions. These optimal points serve as key reference points for decision-making and strategic planning, guiding resource allocation and prioritization efforts to achieve optimal outcomes.