Home / Group 2 / Maintenance Strategies
Engineering high performing products
A systems undergoes many stresses during its lifetime and there are many extreme loads that the civil system must withstand. A concrete dam for example, must withstand the immense pressure of the water body, it must withstand the different seasons of the year, which can bring a different water load, etc. However due to the nature of the construction effort that a such a complex system undergoes, it must have a long lifetime. A concrete dam for example should be designed to last at least 120 years, and all sub-systems within this integrated system must have a corresponding lifespan.
Therefore, a suitable maintenance strategy is crucial. As the systems and subsystems considered for integration are a concrete gravity dam, a maintenance tunnel inside the dam, a water pipe running along the width of dam and a drainage pipe aligned along the length of the dam. The foremost assumption taken into account is that the deterioration rate of concrete water pipes and the drainage pipes is greater than the deterioration rate of the dam and tunnel. Therefore, interventions taken for the dam, such as coating compounds, concrete replacement and resin injection, will have higher occurrence frequency compared with interventions of the other systems. Herein lies the first challenge therefore – aligning maintenance strategies. For our study, the three high performance criteria that were considered are the following:
- Product availability,
- The time between two successive maintenance interventions. This should be at a maximum.
- The time that the system is out of use due to maintenance interventions. This should be at a minimum.
Therefore, it is useful to bundle as many maintenance tasks as possible, wherever possible.
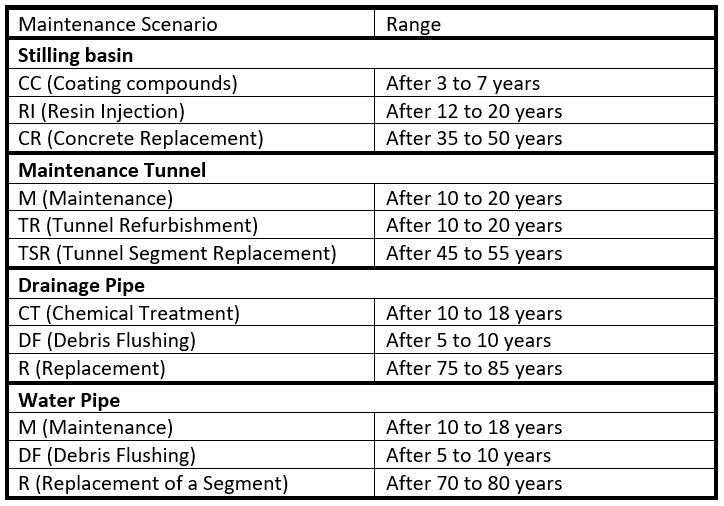
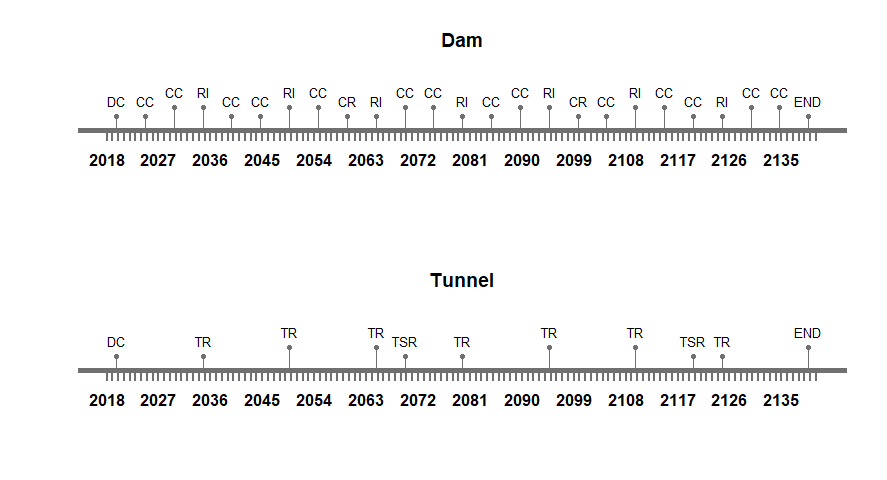
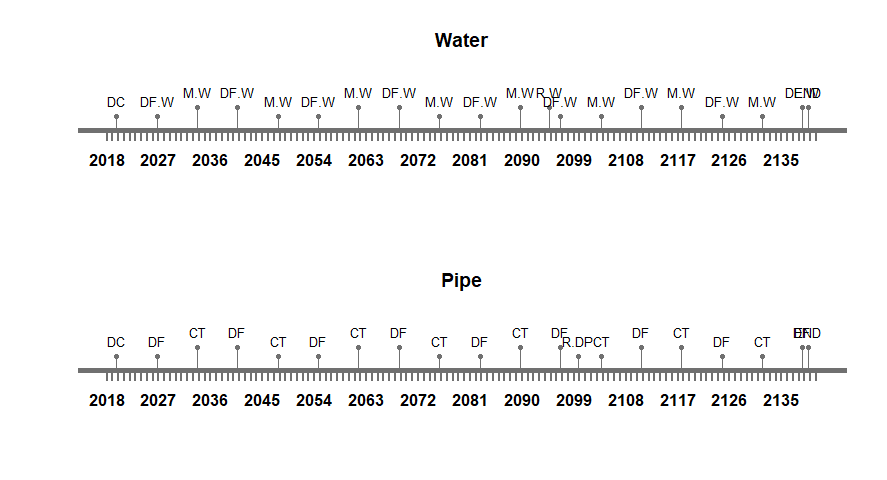
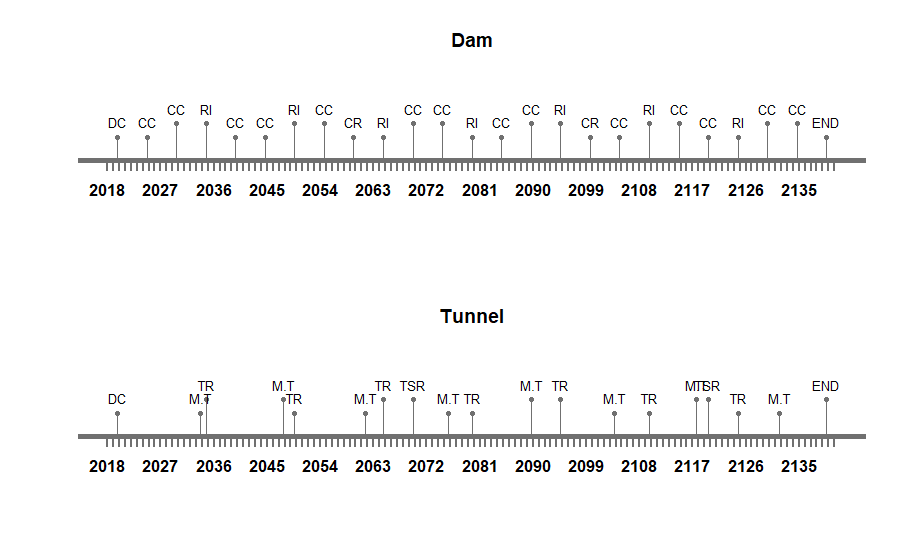
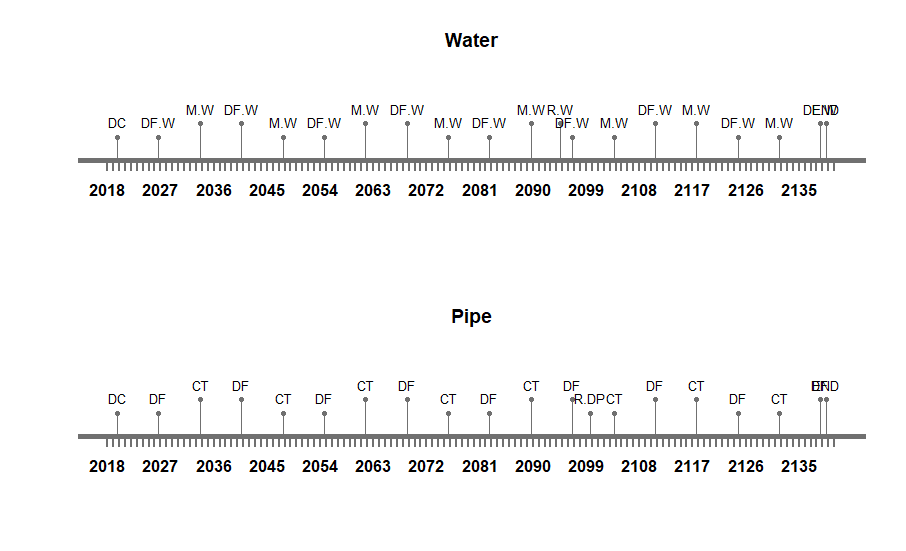
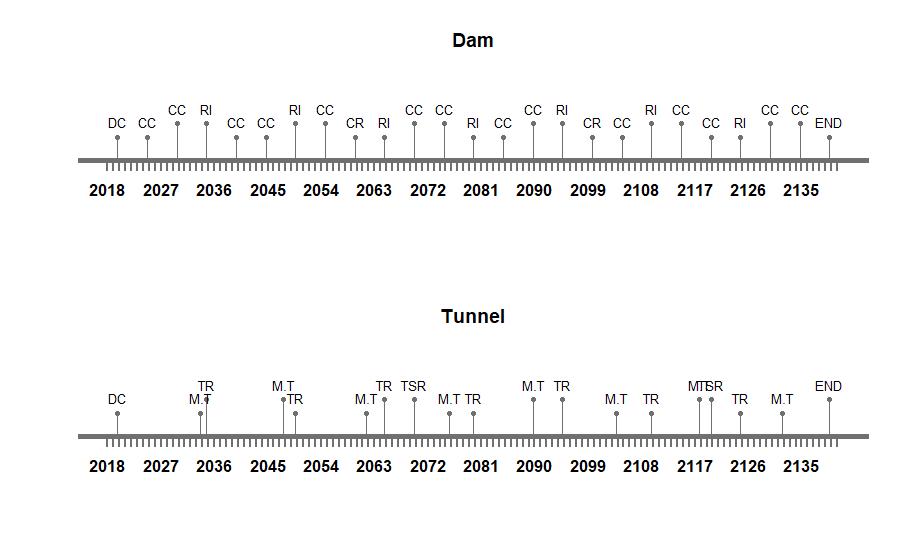
In the figures below, the maintenance strategies of the separate systems from assignment 2 are presented. For this third assignment, the different strategies were extended to include time ranges rather than set years when the maintenance should take place. The ranges for the different maintenance strategies of each system are presented in table 9.
Maintenance Process
While when initiated the process of maintenance of a combined system, the duration of construction and time to dismantle are not taken into account. The start date adopted for the maintenance assessment is 01/01/2020 and the total design period considered is 120 years, as all are systems integrated well into the final system. Similarly the interventions and frequency of every system is well defined in the onset. Intervention times are always added as days for the current study. After combining all the time lines of various systems, the total durations of interruptions is analyzed.
Scenario I
Each combination of systems maintenance are done at a time and one system alone is not interfered. Iterations for this scenario is carried out to compute the sum of intervention.
Length of duration of 3 systems is considered as zero.
Based on the planning strategy, we currently have a total of 58 days interruptions for 120 years lifetime.
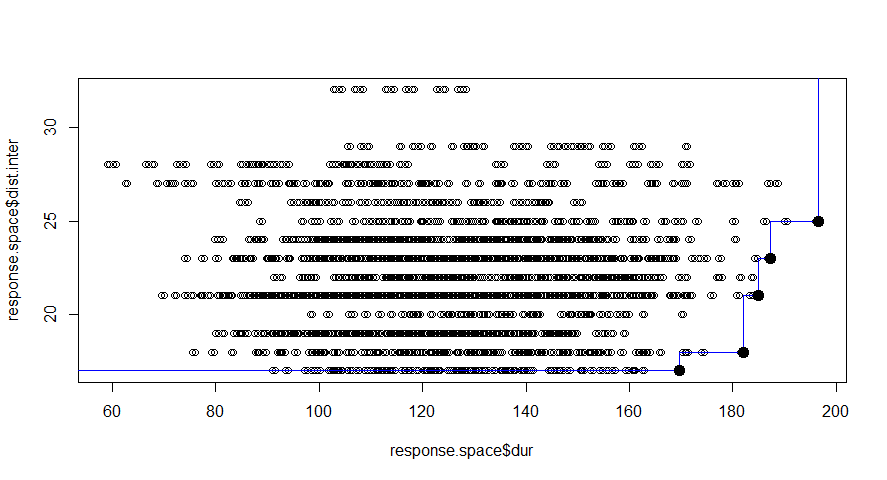
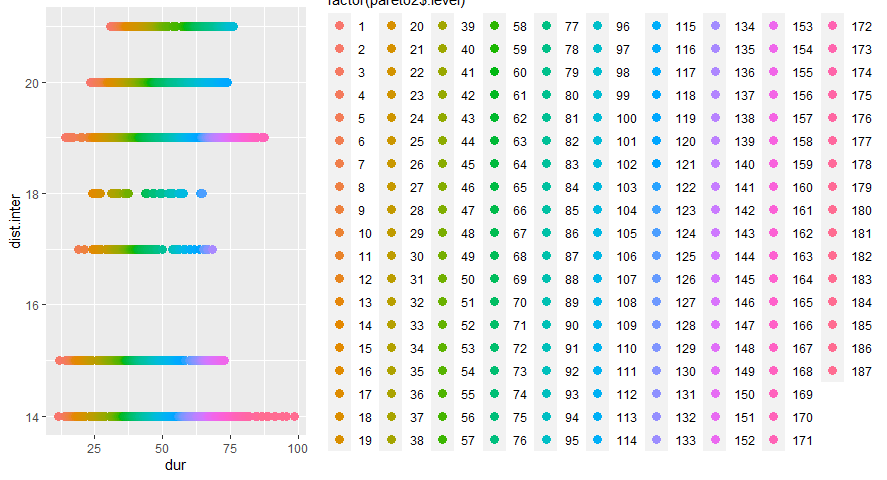
Design space is defined for each systems. Our preference is to minimize the duration of the interruptions and to maximize the distance between interventions. And finally to arrive at best option of maintenance.
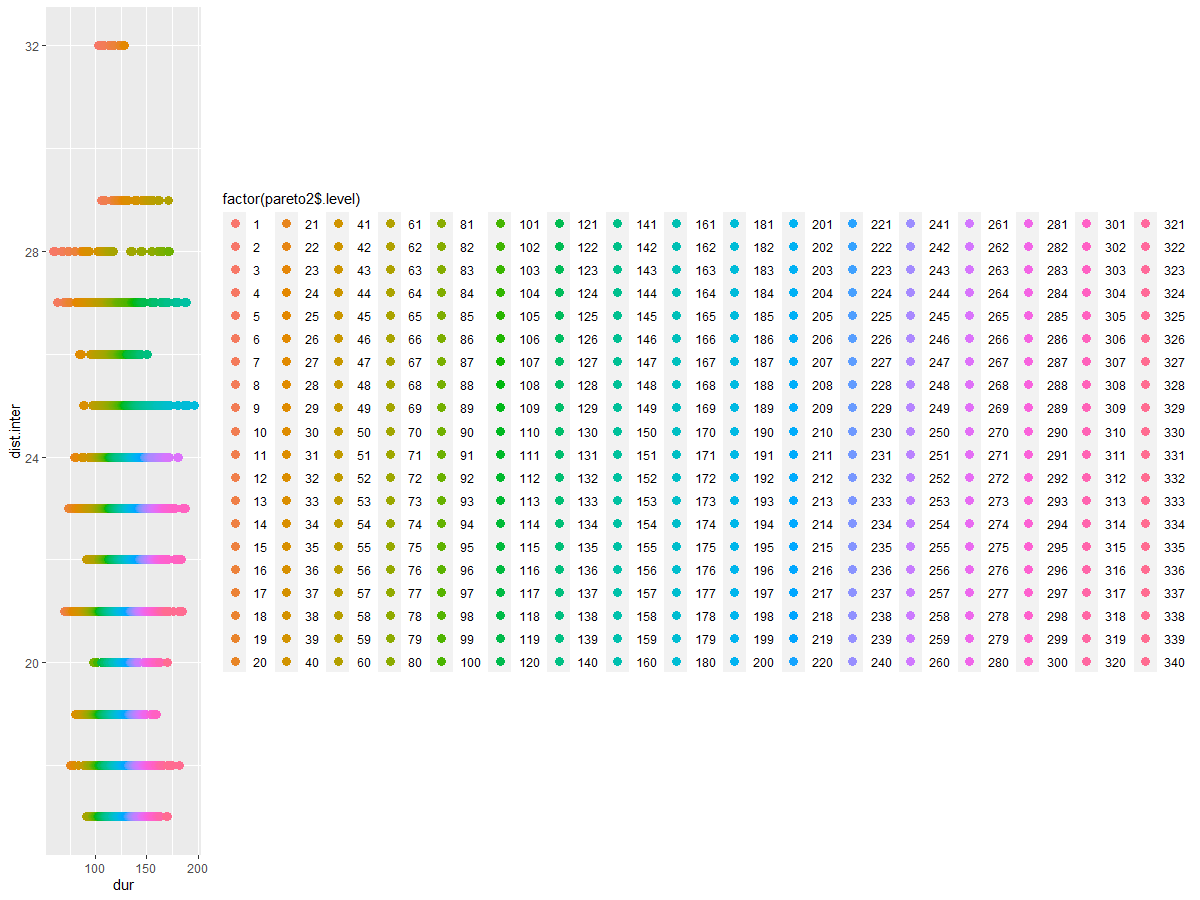
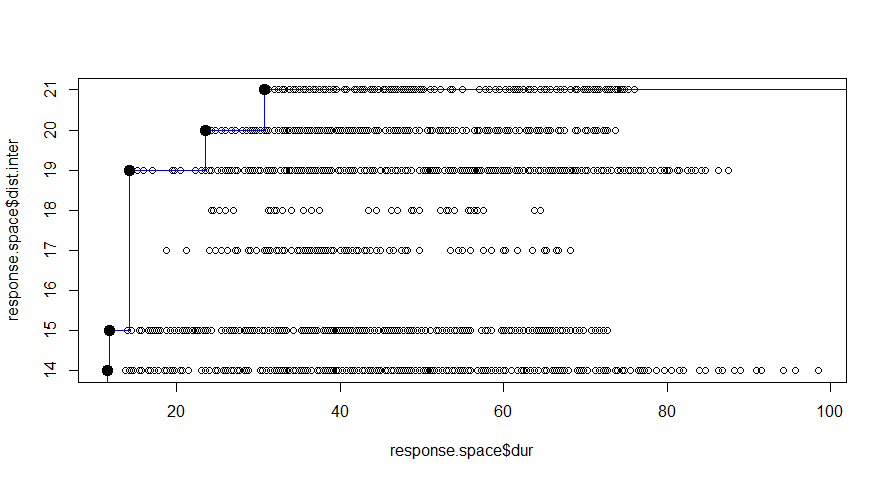
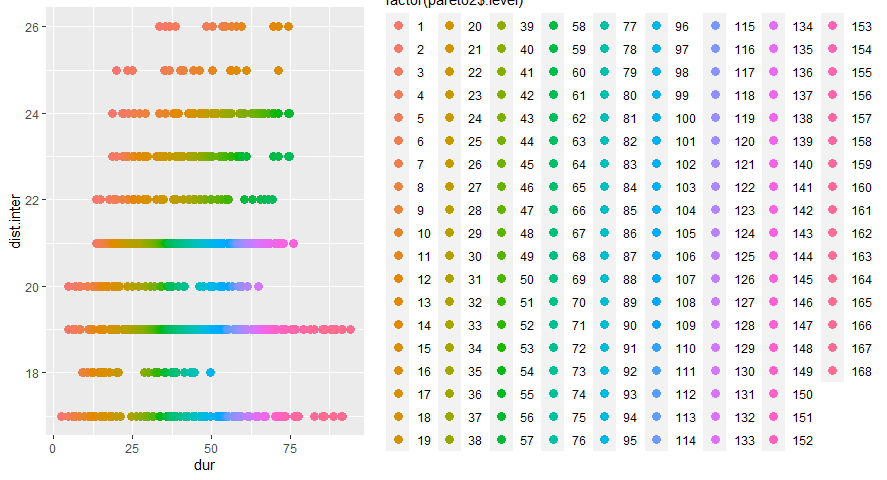
In this figure the alternatives we explored are ranked based on the defined preference. These are presented as 340 groups. We know the color of the highest rated alternatives, but at this point it is difficult to identify these. A good way to improve the graphical representation is to make use of Pareto Frontier.
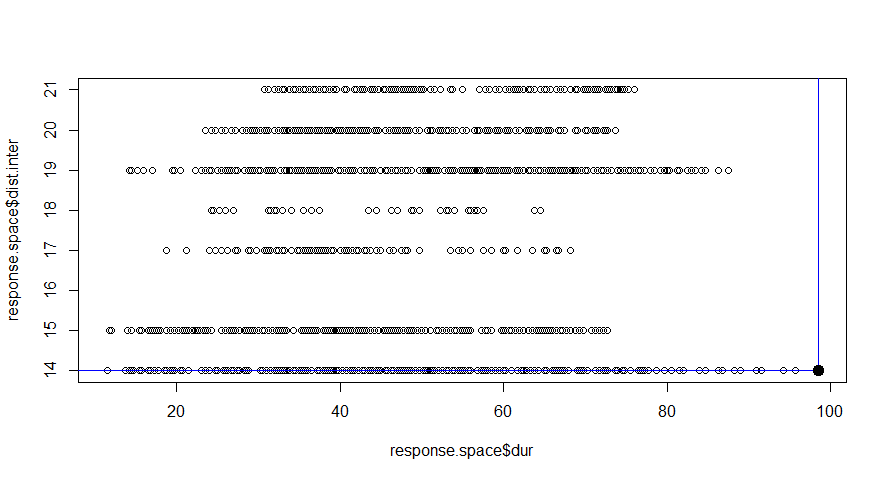
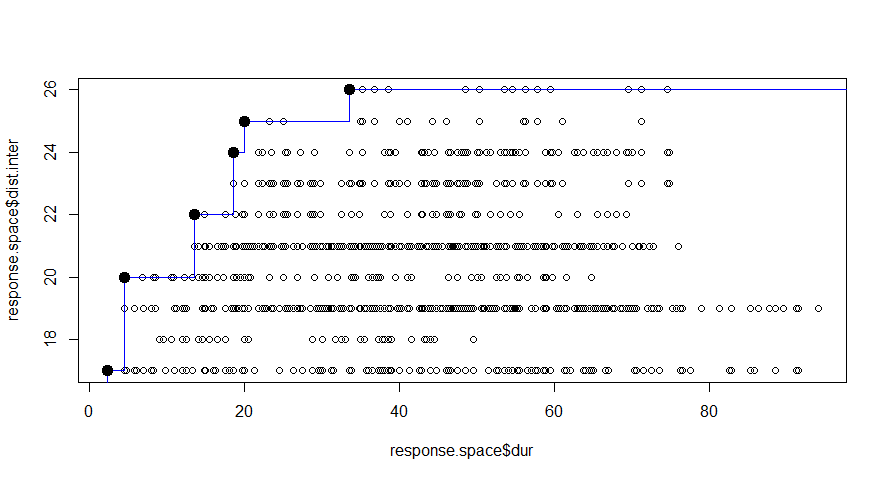
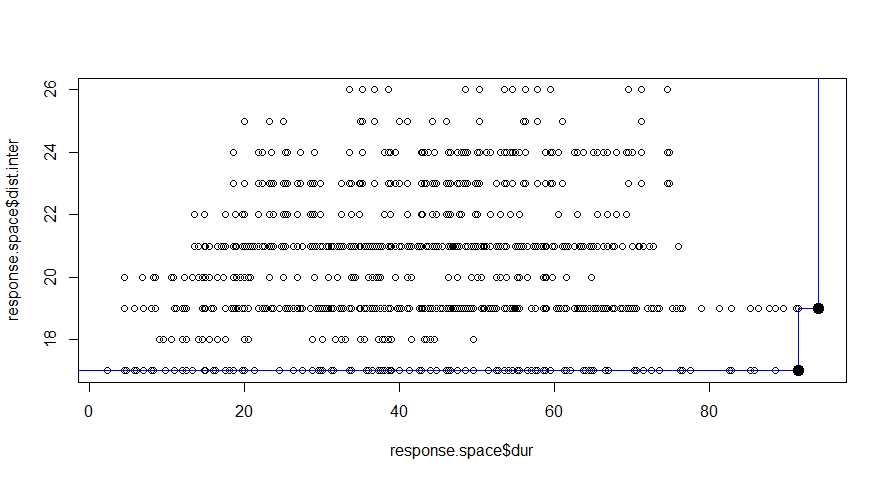
The blue line represented the Pareto frontier, where the dark black point in the top-left corner represent the best alternative based on the defined preferences.
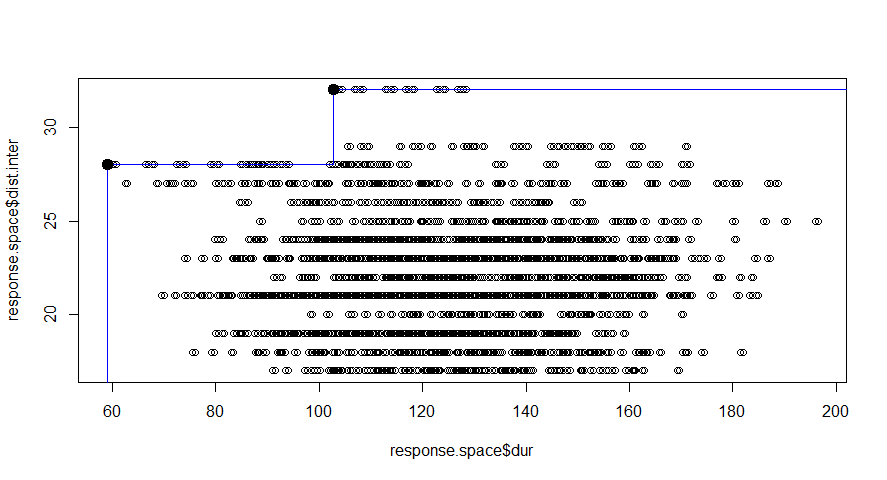
This method is good at ranking the results we obtain, but is just a ranking method based on predefined preferences.
Scenario II
Each combination of systems maintenance are done at a time and two system alone is not interfered. Iterations for this scenario is carried out to compute the sum of intervention for this.
Length of duration of 2 systems is considered as zero.
Based on the planning strategy, we currently have a total of 43 days interruptions for 120 years lifetime.
Scenario III
For one system alone maintenance are done at a time and other three is not interfered. Iterations for this scenario is carried out to compute the sum of intervention for this.
Length of duration of 1 system is considered as zero.

Based on the planning strategy, we currently have a total of 25 days interruptions for 120 years lifetime.
With the help of R it was possible to evaluate the maintenance scenario ranges of the four different systems and to optimize the overall maintenance strategy by combining and bundling the maintenance of the separate systems wherever possible, thereby increasing the likelihood, that the system will be out of use for a shorter timespan.