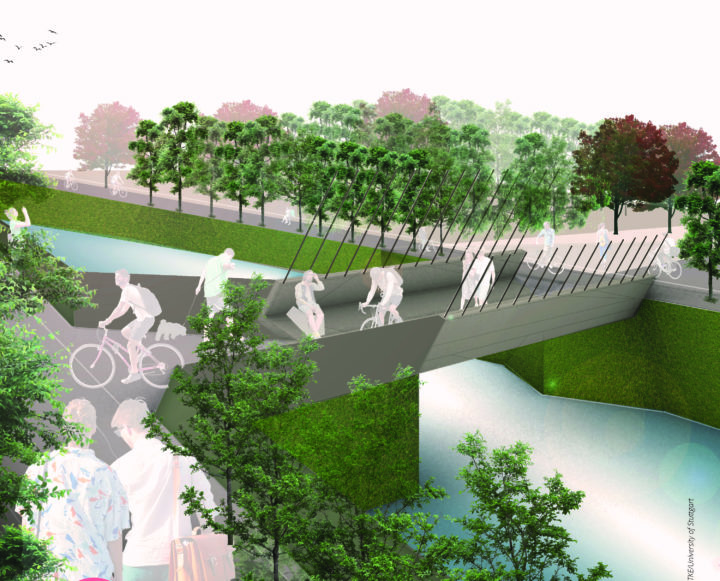
Bio-Based Composite Bridge
Introduction
Before concrete or steel bridges, wooden bridges or timber bridges are probably the first type of bridge to appear in human history. As a building material with a long history, it has many advantages. For example, wood is a renewable resource, and wood can be built in various kinds of weather (Ou & Weller, 1986). Until today, numerous short and medium-span bridges still use wood as a bridge material (Ritter, 1990). However, most of these wooden bridges are constructed a long time ago. The majority of wooden bridges are not designed for the modern background (Rashidi et al., 2021). Especially, wood is easy to be decayed by the natural environment. Therefore, for new applications that are more environmentally friendly, we have turned our research direction to Bio-Based Composite Bridge.
The construction industry is recognized as one of the largest contributors to resource consumption and waste generation (Gervásio, 2010). In order to minimize the industry’s impact on the environment, the construction industry has been seeking to introduce sustainable materials throughout its production chain. One example is the use of Timber-Concrete Composite (TCC) structures for bridges. (Rodrigues et al., 2016) Not only the use of wood-concrete composite materials but also more sustainable and environmentally friendly building materials that are environmentally friendly, such as bamboo. Kim et al. (2013) developed a new type of glulam girder called GluBam, using laminated bamboo veneers. This material is a new type of environmentally friendly building material with development prospects, which can be used for bridges or building materials. Deresa et al. (2019) introduce a new type of bio-based construction material similar to TCC just mentioned, using bamboo as a composite material, called Bamboo-Concrete Composite (BCC). Compared with traditional reinforced concrete materials, these bio-based building materials have innovative and environmentally friendly conditions. It is a topic worthy of discussion, and it will also be the direction that the construction industry is trending.
In the first part of this assessment, we assess wooden bridges’ integrity and investigate the reason for their possible failure by developing the Markov chain model and the fault tree analysis.
In the second part, we focus on analyzing the carbon footprint of a bio-based bridge, including TCC and BCC. Analyzing how practitioners can make the right decisions when designing bio-based bridges. The scope and boundary are shown below.
Wooden Bridge Deterioration Modeling
The deterioration prediction model of wooden bridges in this essay is based on the inspection records from the National Bridge Inventory (NBI) in the U.S. The rating categories are with a numerical rating method from 9 to 0.
If the condition is 4 or below, the bridge is judged to be structurally deficient. Basically, engineers take a rating of 4 as the threshold for rehabilitation and replacement purposes (Kumar et al., 2018).
| Table1. Condition Rating Descriptions (Administration, 1995) | ||
| Rating | State | Description |
| 9 | Excellent | New condition, no noteworthy deficiencies |
| 8 | Very good | No repair needed |
| 7 | Good | Some minor problems, and minor maintenance needed |
| 6 | Satisfactory | Some minor deterioration, major maintenance needed |
| 5 | Fair | Minor section loss, cracking, spalling, or scouring for minor rehabilitation; minor rehabilitation needed |
| 4 | Poor | Advanced section loss, deterioration, spalling or scouring; major rehabilitation needed |
| 3 | Serious | Section loss, deterioration, spalling or scouring that have seriously affected the primary structural components |
| 2 | Critical | Advanced deterioration of primary structural elements for urgent rehabilitation; bridge maybe closed until corrective action is taken |
| 1 | Imminent failure | Major deterioration or loss of section; bridge may be closed to traffic, but corrective action can put it back to light service |
| 0 | Failed | Out of service and beyond corrective action |
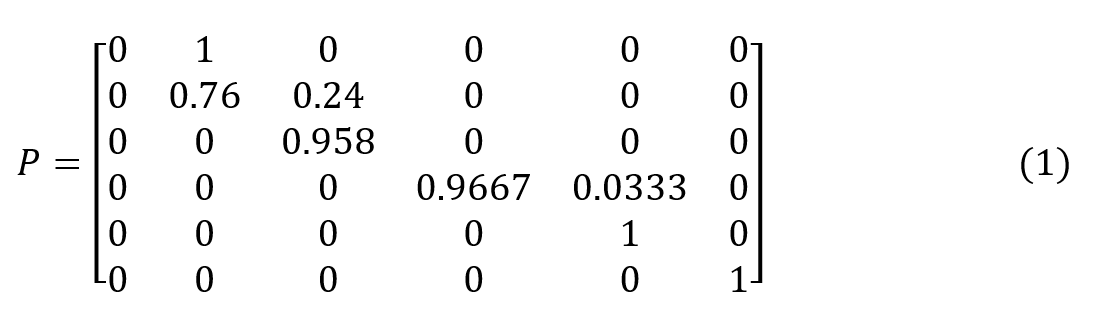
The transition matrix of wooden bridge is shown in (1) which is from Deterioration models for prediction of remaining useful life of timber and concrete bridges: A review (Ranjith et al., 2013) uses the NBI records for one year (2011 to 2012).
The condition rating of bridge at time t is shown in (3).
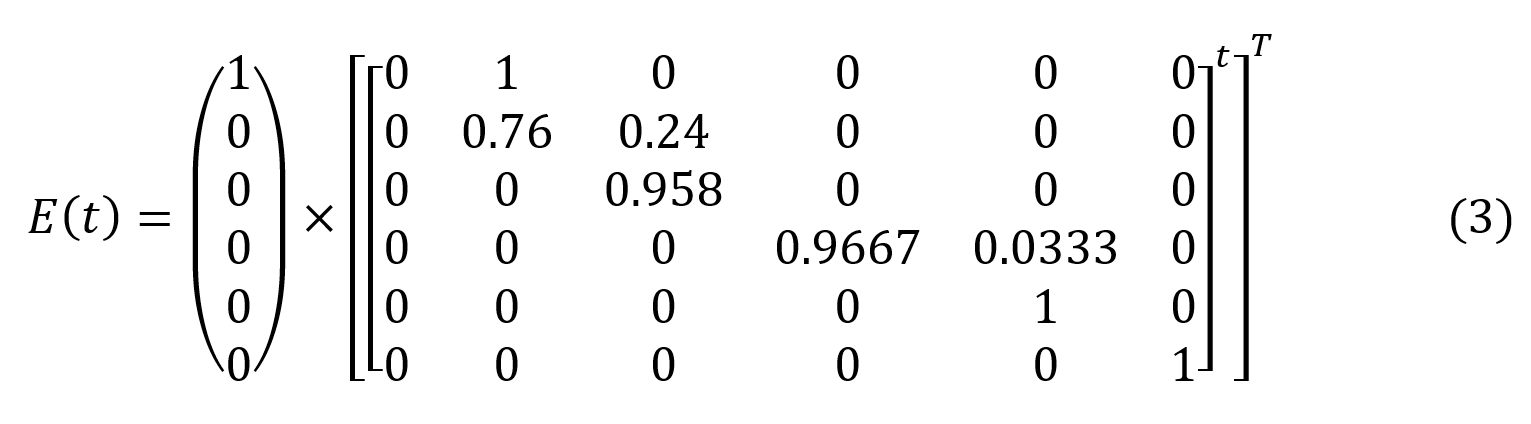
We assume the time period t = 15 years with the current condition rating 9 which is Excellent.
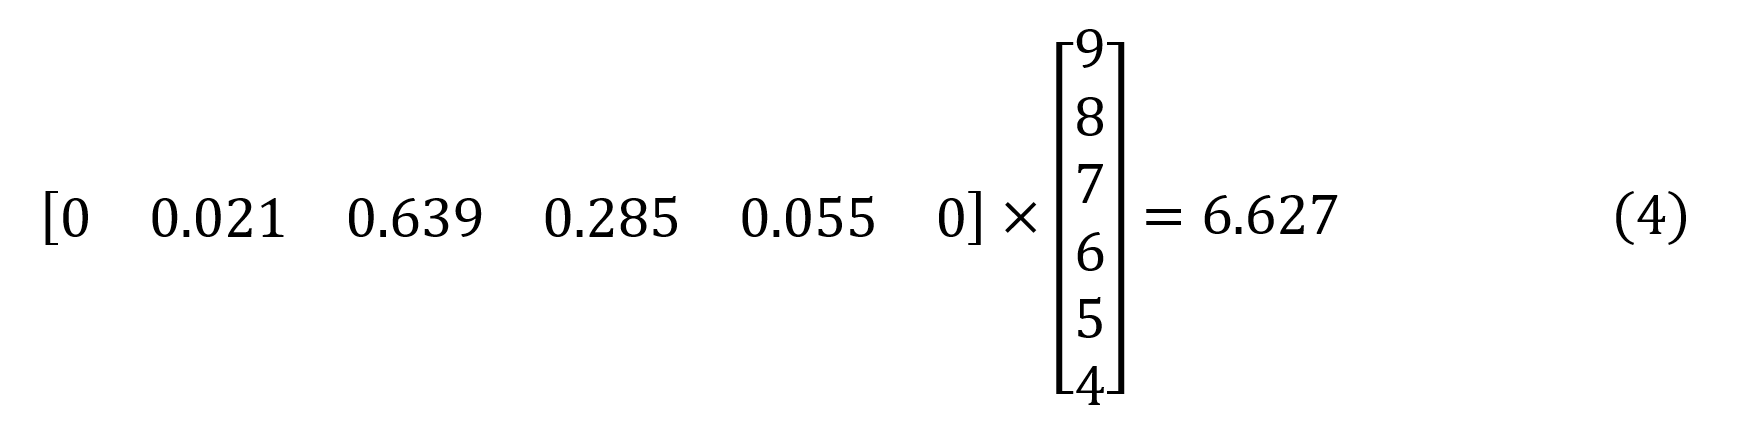
- 0% chance that the bridge condition will be “Excellent”
• 2.1% chance that the bridge condition will be “Very good”
• 63.9% chance that the bridge condition will be “Good”
• 28.5% chance that the bridge condition will be “Satisfactory”
• 5.5% chance that the bridge condition will be “Fair”
• 0% chance that the bridge condition will be “Poor”
We take the expected average rating condition at 15 years is obtained as 6.627 by (4).
Life-Cycle Analysis and Multi-Criteria Decision Analysis of
Bio-Based Composite Bridge
Goal and scope of LCA
The scope and boundary are shown below. 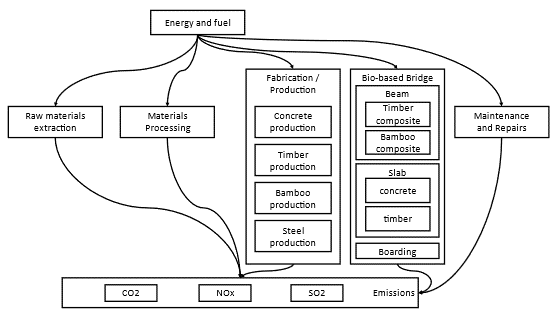
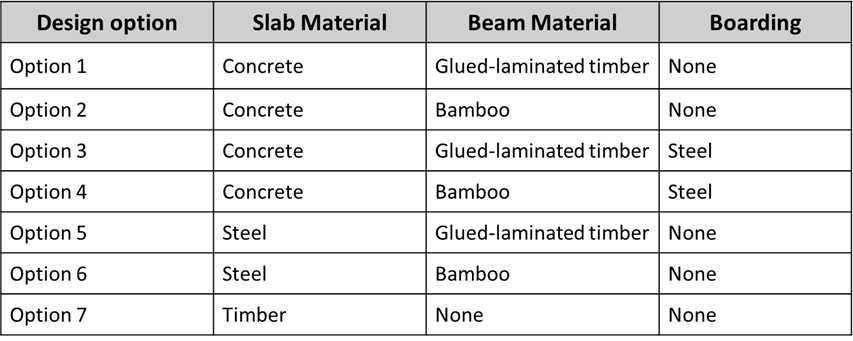
The seven different option design alternatives that we will analyze are shown in the figure below.
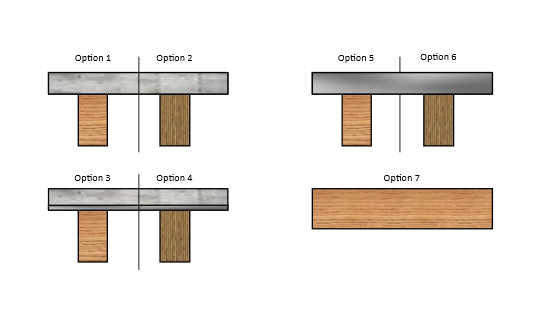
The material selection options include three major aspects, Slab, Beam, and Boarding.

The alternative material selections we choose for this assessment are represented in the following table.
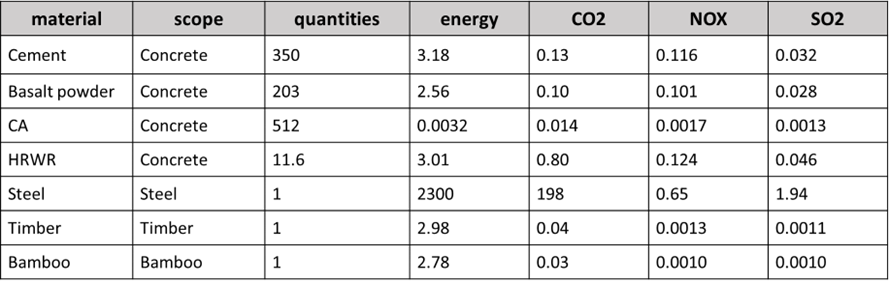
The materials used for different elements in this assessment are shown below.

The table below shows the composition of different materials used.
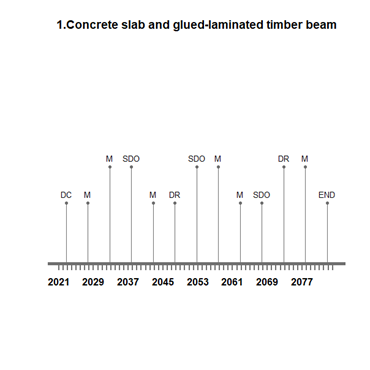
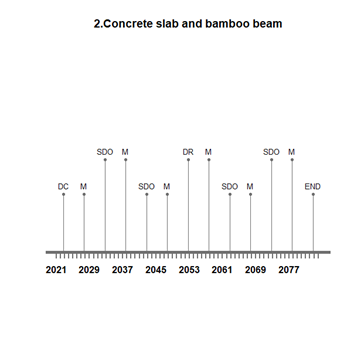
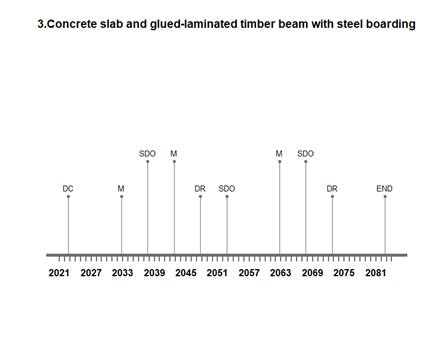
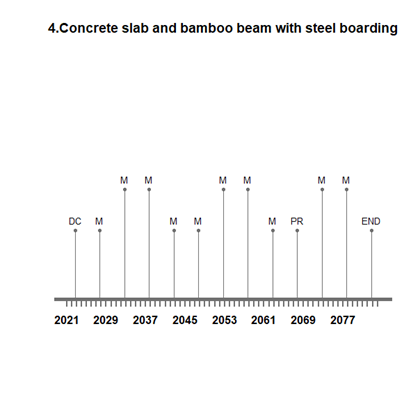
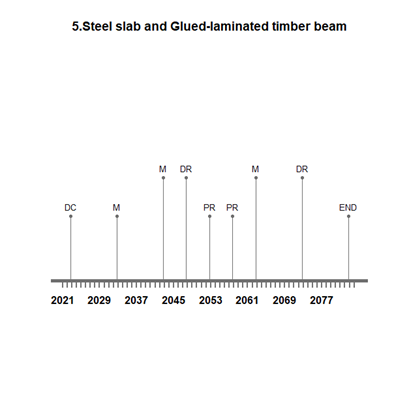
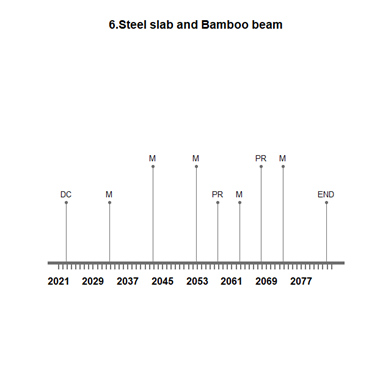
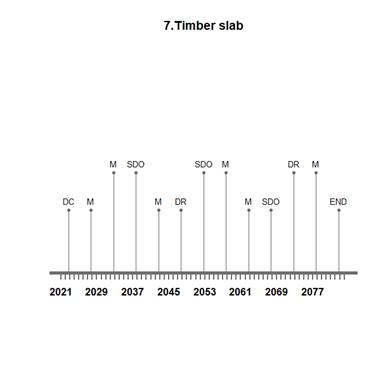
Life-Cycle timeline
European regulations require a design life of 100 years (Dias et al., 2011). Therefore, we set the lifetime parameter to 100 years. Other data refer to relevant literature and make the following assumptions (Claassen & Zarifis, 2020; Tazarv et al., 2019).
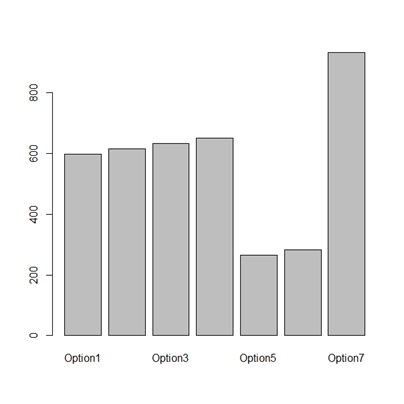
Life Cycle Inventory and Analysis
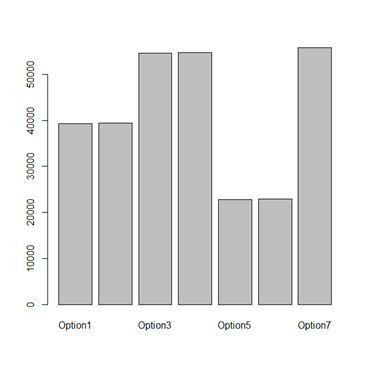
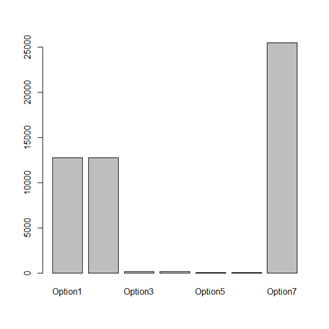
Based on the life cycle inventory of materials and design options we proposed, the bar plot visualizes different levels of energy, CO2, NOx, and SO2 emissions for different options. Last, we generate radar diagrams to present the performance indicators.
energy consumption level for different design options.
CO2 emissions for different design options
NOx emissions for different design options
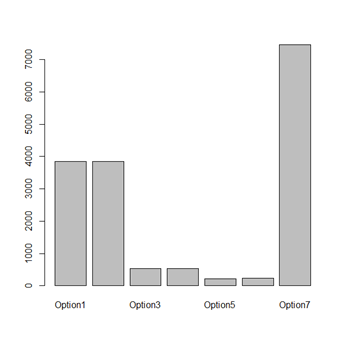
SO2 emissions for different design options
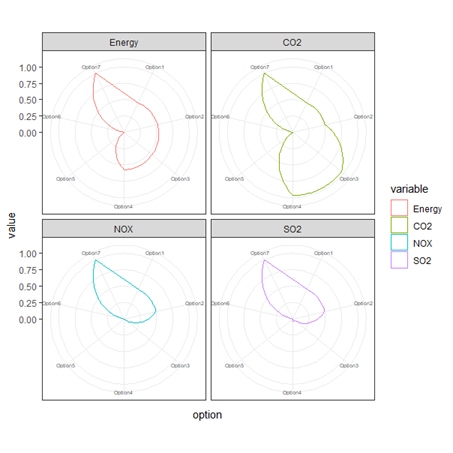
Radar plot of the performance indicators
The defined score matrices based on the 1-9 Saaty’s scale for each performance criterion are shown in the tables below.
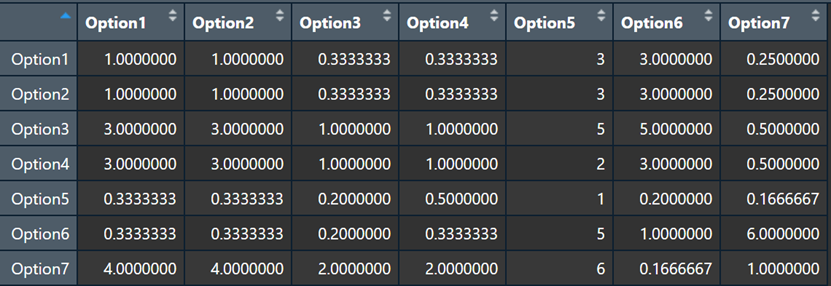
Energy
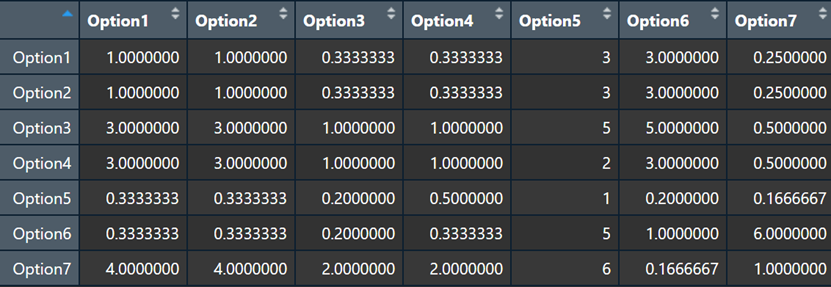
Co2
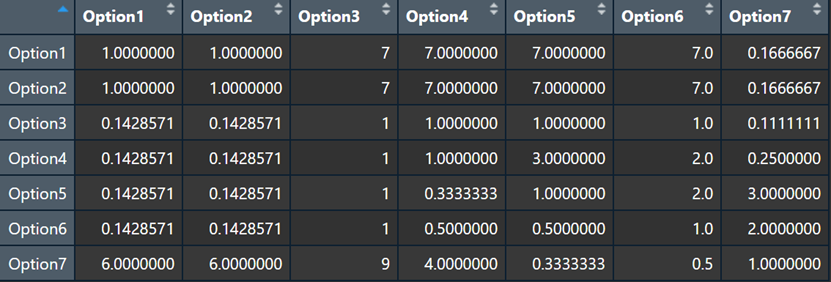
NOx
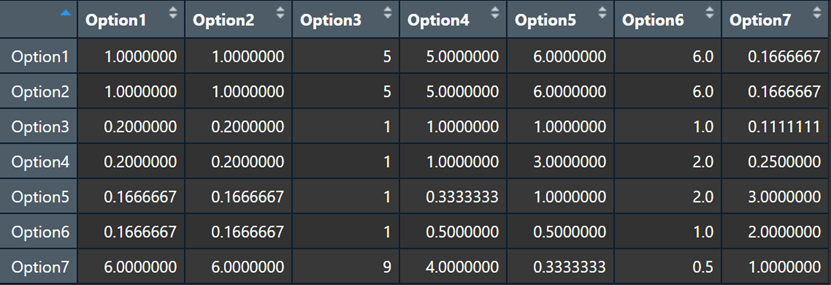
SO2
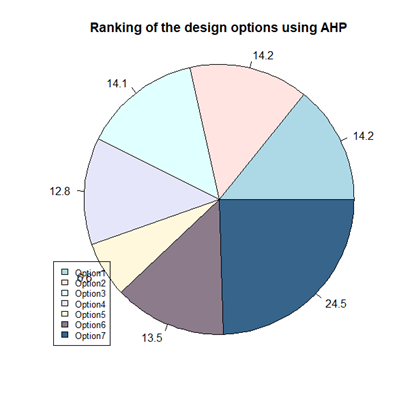
The result pie chart of AHP is shown below.
Reference
Ou, F. L., & Weller, C. (1986). An overview of timber bridges. Transportation Research Record, 1053, 1-12.
Phares, B., Dahlberg, J., & Klaiber, W. (2015). Cost-Efiective Timber Bridge Repairs: Manual for Repairs of Timber Bridges in Minnesota. Minnesota Department of Transportation.
Rashidi, M., Hoshyar, A. N., Smith, L., Bijan, S., & Siddique, R. (2021). A comprehensive taxonomy for structure and material deficiencies, preventions and remedies of timber bridges. Journal of Building Engineering, 34, 101624. https://doi.org/https://doi.org/10.1016/j.jobe.2020.101624
Ritter, M. A. (1990). Timber bridges: Design, construction, inspection, and maintenance. US Department of Agriculture, Forest Service, Engineering Staff.
Gervásio, H. M. d. S. (2010). Sustainable design and integral life-cycle analysis of bridges
Rodrigues, J. N., Providencia, P., & Dias, A. (2016). Sustainability and Lifecycle Assessment of Timber-Concrete Composite Bridges. Journal of Infrastructure Systems, 23, 04016025. https://doi.org/10.1061/(ASCE)IS.1943-555X.0000310
Kim, H., Anderson, K., Lee, S., & Hildreth, J. (2013). Generating construction schedules through automatic data extraction using open BIM (building information modeling) technology. Automation in Construction, 35, 285-295. https://doi.org/https://doi.org/10.1016/j.autcon.2013.05.020
Deresa, S., Ren, H. T., & Xu, J. (2019). Flexural behavior of glubam-recycled aggregate concrete composite beam. In (pp. 173-180). https://doi.org/10.1201/9780429434990-17
Kumar, R., Matias de Oliveira, J. L., Schultz, A., & Marasteanu, M. (2018). Remaining Service Life Asset Measure, Phase 1.
Dias, A. M., Ferreira, M. C., Jorge, L. F., & Martins, H. M. (2011). Timber–concrete practical applications–bridge case study. Proceedings of the Institution of Civil Engineers-Structures and Buildings, 164(2), 131-141.
Claassen, W., & Zarifis, G. (2020). First Bio-Based Composite Movable Bicycle Bridge. Structural Engineering International, 31, 1-6. https://doi.org/10.1080/10168664.2020.1840945
Tazarv, M., Carnahan, Z., & Wehbe, N. (2019). Glulam timber bridges for local roads. Engineering Structures, 188, 11-23. https://doi.org/https://doi.org/10.1016/j.engstruct.2019.03.012