Goal and Scope Definition
The focus of the Life Cycle Inventory (LCI) and Analysis of the integrated one-story and multi-story residential buildings in this study is on the environmental and economic impacts of the systems throughout their life cycle. This analysis aims to quantify resource consumption, emissions, and energy usage associated with the construction, operation, maintenance, and repair activities of the integrated system. By understanding these factors, we aim to develop optimized maintenance strategies that minimize environmental impact while ensuring long-term serviceability.
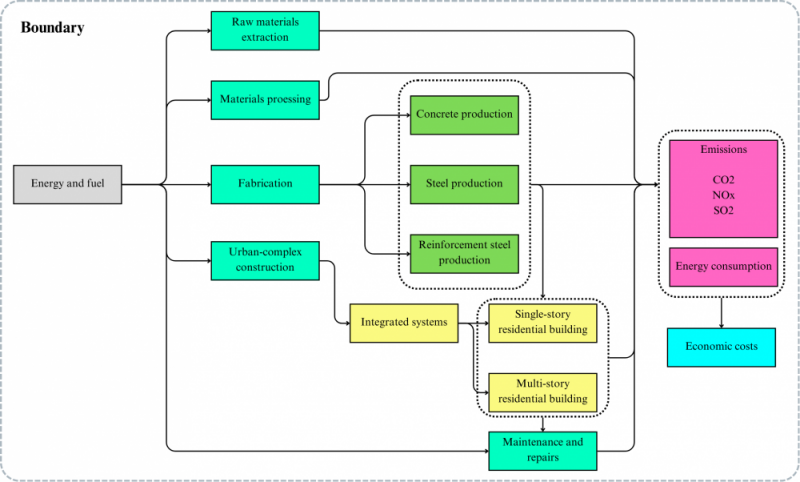
The scope of this study includes the entire life cycle of the integrated building system, from raw material extraction to maintenance and repair activities. As depicted in Figure 1, the system boundary encompasses multiple stages:
- Raw Material Extraction and Processing: The production of concrete, steel, and reinforcement materials used in construction.
- Fabrication and Construction: The transformation of raw materials into building components and the assembly of structures within an urban complex.
- Maintenance and repairs: The use and maintenance of the one-story and multi-story buildings, including periodic repairs and system upgrades.
- Emissions and Energy Consumption: Environmental impacts such as CO₂, NOₓ, and SO₂ emissions, along with overall energy usage throughout the building life cycle.
- Economic Costs: The financial implications of material production, energy consumption, and maintenance interventions.
for our integrated system we follow a cradle-to-operation approach, meaning it includes all processes from raw material extraction to long-term maintenance but does not consider demolition and disposal.
Figure 1.
Life-Cycle Inventory of Materials
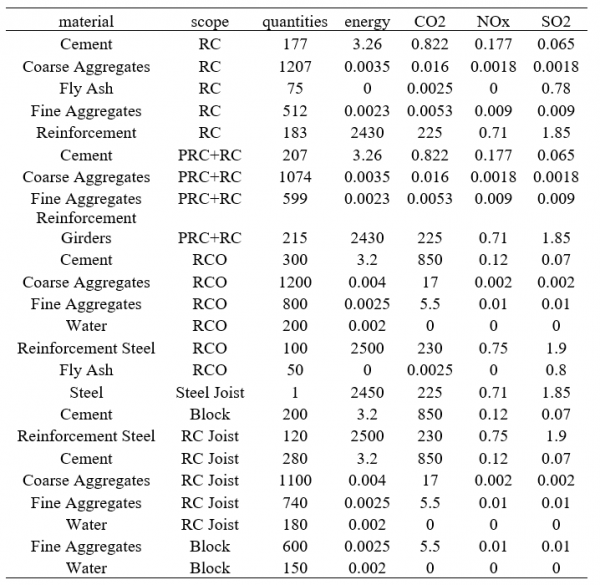
The table 1 categorizes materials based on their scope in construction, including RC (Reinforced Concrete for the first system), PRC+RC (Precast & Reinforced Concrete), RCO (Reinforced Concrete for the second system), Steel Joist, RC Joist, and Block type. Each entry provides the following information:
- Quantities: The total amount of material used in the construction process is calculated based on standard material requirements for one cubic meter of reinforced concrete.
- Energy Consumption: The energy required for material production and processing.
- CO₂, NOₓ, and SO₂ Emissions: The environmental impact associated with the use of each material.
Table 1.
For the RC residential building system, the proposed coefficients (Table 2) for maintenance events (M, PR, CR) are determined based on lifecycle assessment studies and structural repair guidelines. Routine maintenance operations (M), such as minor repairs, sealing, and inspections, are assigned a coefficient of 0.15, reflecting their relatively low impact on the overall structural integrity compared to full replacement. This is justified by guidelines in ACI 546R-14[1] and ISO 16311-2[2], which indicate that routine maintenance primarily serves to delay deterioration rather than restore full performance. Partial replacement (PR), which includes localized concrete repair, reinforcement treatment, and resurfacing, is given a coefficient of 0.30, as it represents a more substantial intervention that restores some structural capacity but does not equate to a full system overhaul. This value is derived from EN 1504-9:2008[3] and Fib Model Code 2010[4], where partial repair strategies are quantified based on material loss and rehabilitation efficiency. Finally, critical repair (CR), which involves significant structural restoration, such as large-area concrete replacement and reinforcement strengthening, is assigned a coefficient of 0.70. This higher value reflects its extensive impact on structural integrity, nearing full replacement but still not requiring complete reconstruction. This assumption aligns with empirical engineering studies on major infrastructure maintenance from Fib Model Code 2010. These coefficients ensure that interventions are proportionally scaled in lifecycle cost analysis, enabling a more accurate maintenance strategy optimization for long-term performance and cost efficiency.
Table 2.
Using the values from the Life-Cycle Inventory of Materials table, the results of the Life Cycle Assessment (LCA) are generated for various material combinations. The figure presents one example from the 312 possible combinations.
Figure 2. Energy consumption and GHG emissions in Strategy 2 combination 1
We calculated the other 2 alternatives and got the results as follows:
Figure 3. Energy consumption and GHG emissions in Strategy 1 (a) and Strategy 2 combination 2 (b)
The energy consumption and GHG emissions in strategy 2 combination 1 are more optimal.
By defining unit prices for each material and emission type, the LCA results can be further refined, as illustrated in Figure 2. Based on these updated results, a multi-objective optimization function is applied to identify the most efficient maintenance strategy among the 312 combinations, ensuring an optimal balance between cost, environmental impact, and serviceability.
Table 3.
Figure 3.
References
[1] ACI 546R-14 (2014). Concrete Repair Guide. American Concrete Institute. https://www.concrete.org/portals/0/files/pdf/previews/546r_14_preview.pdf
[2] ISO 16311-2 (2014). Maintenance and repair of concrete structures – Part 2: Assessment of damage and design of repairs. International Organization for Standardization. https://www.iso.org/standard/79786.html
[3] EN 1504-9 (2008). Products and systems for the protection and repair of concrete structures – Part 9: General principles for the use of products and systems. European Committee for Standardization. https://standards.iteh.ai/catalog/standards/cen/7d62badc-ab4b-44e3-8457-6d34c84dfd64/en-1504-9-2008?srsltid=AfmBOorA5dK6y8aXVjaEXuLwnWxyVy0JGbBXMfDpkeuyreasusoyJSrg
[4]Fib Model Code (2010). Model Code for Service Life Design. Fédération Internationale du Béton. https://www.fib-international.org/publications/fib-bulletins/model-code-2010-first-complete-draft,-vol-1-pdf-detail.html
[5] Eurostat. (2024). Electricity price statistics. European Commission. Retrieved January 27, 2025, from https://ec.europa.eu/eurostat/statistics-explained/index.php?title=Electricity_price_statistics
[6] Umweltbundesamt. (2023). Environmental unit cost lists 2023. Umweltbundesamt. Retrieved January 27, 2025, from https://www.umweltbundesamt.de/sites/default/files/medien/11850/publikationen/159_2023_texte_environmental_unit_cost_lists.pdf
[7] Department for Environment, Food & Rural Affairs (DEFRA). (2023). Damage cost update 2023. DEFRA. Retrieved January 27, 2025, from https://uk-air.defra.gov.uk/assets/documents/reports/cat09/2301090900_Damage_cost_update_2023_Final.pdf


