1. Introduction
In the first project, the focus laid on the analysis of the entire wind turbine system. For this project, the focus shifts to a singled-out component. The components/subsystem chosen for the offshore wind turbine system are the rotor blades. The rotor blades experience the most stress and pose a lot of danger if they break. Therefore, a safe but aerodynamic efficient design must be used. The two properties that can be changed to achieve this, are the materials used and the shape of the blade itself. This project aims to find out, what effect the usage of different materials and shapes pose to the environment. This project analysis the amount of materials used through initial construction and repairs over the course of the subsystem’s lifetime, including resulting emissions caused by production, transportation, repairs, and deconstruction. The goal of this Life Cycle analysis is to figure out the least environmental damaging materials that are serious options, considering the large forces wind turbine blades are exposed to.
2. Design Options
The analysis of emissions during the life cycle of any system, starts with setting the boundary, to decide what counts into it. The boundary consists the entire life cycle of used materials, starting with material mining and ending with the recycling/disposing of the material. The resulting total emissions are the outcome of the analysis.
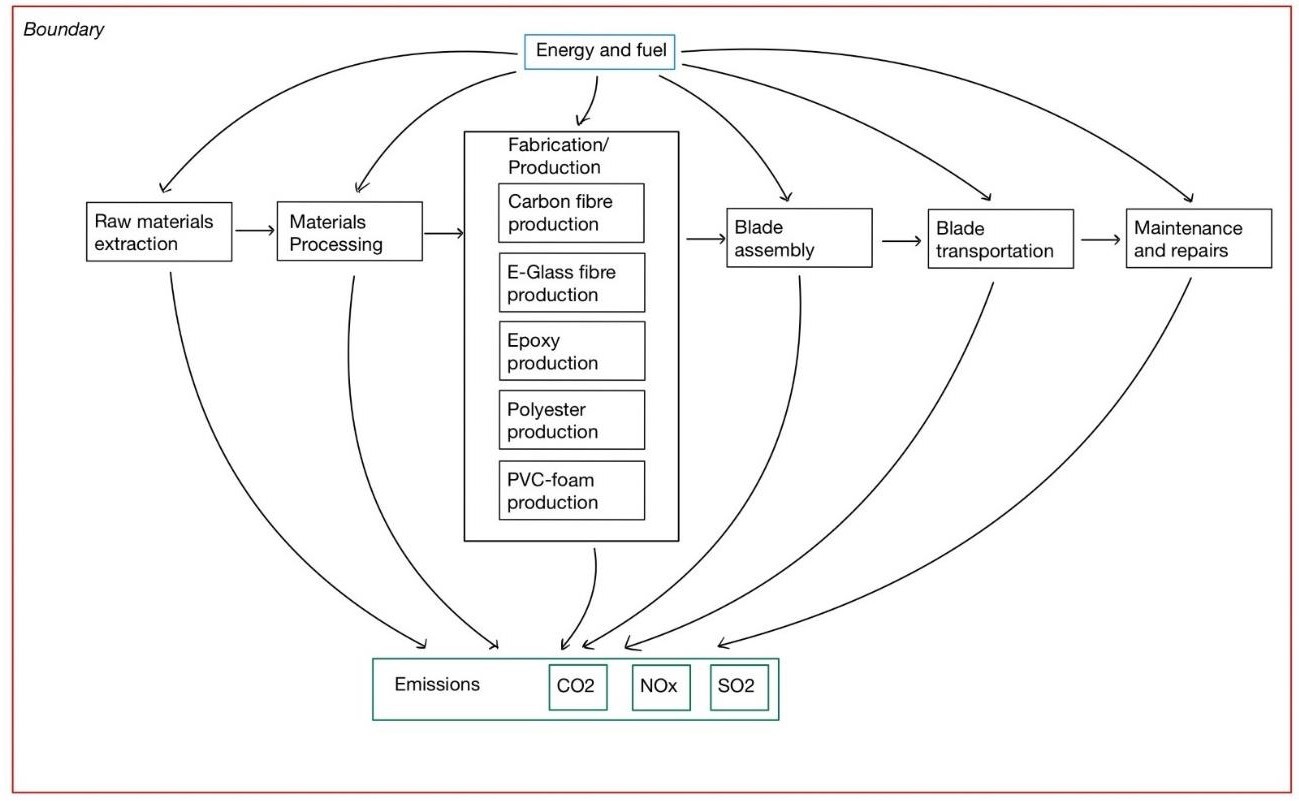
Figure 1: Emissions boundary of a turbine rotor blade
To conduct a Life Cyle Analysis (LCA) it is important to know, what kind of system is available and what materials are used to construct it. For civil systems there are usually many ways to construct them, therefore the environmental damage caused by emissions can be reduced, depending on the materials used. In the following three options of producing a wind turbine blade will be introduced and compared. Due to the needed aerodynamic efficiency, turbine blade shapes have been unified and are build the same for each length. Therefore, the same cross-section for all three options is assumed, as well as a length of 63 m for comparability.
A wind turbine blade is made of different components glued together. The fibre-reinforced composite material, the sandwich material and the resin and adhesives make up round about 85% of the weight of one rotor blade (Morini et al., 2022). Knowing that, the focus of the LCA only shifts to these three materials. Through research of what materials are used to build todays wind turbine rotor blades, these three blade composition options were chosen:
| Design Option | Fibre Material | Resin and adhesive | Sandwich material |
| Option 1 | Carbon fibre | Epoxy | PVC-foam |
| Option 2 | E-Glass fibre | Epoxy | Balsa |
| Option 3 | E-Glass fibre | Polyester | PVC-foam |
For each of the three options´ materials, the emissions per quantity considering the entire life cycle must be assumed. The assumptions are based on various sources (references 1-8). In this analysis each material´s emissions are calculated by the amount of kilogram used. This was chosen, because the cross-section area of a rotor blade is not linear throughout the blade´s length. Therefore, it is easier to figure out the total weight of a material used, depending on the length of the blade. For each design option a blade of a length of 63m was chosen. The quantities for E-Glass fibre, epoxy, polyester and balsa were found in (Morini, Ribeiro & Hotza, 2021). The carbon fibre quantity for the same length has been estimated using the density and correlation to Glass fibres found in (Bronsted, Lilholt & Lystrup, 2005). Lastly the quantities of PVC-foam were found in (Galos, Das, Sutcliffe & Mourits, 2022; Stoll, 2014) The emissions for each of the materials were found in the same sources or external sources given (references 2-9). For the chosen blade of 63 m, these emissions have been assumed, based on the boundary set in 2.:
| Materials | Scope | Quantities | Energy | CO2 | NOx | SO2 |
| Carbon fibre | CF | 82.9 | 461 | 30.1 | 0.035 | 0.016 |
| E-Glass fibre | GF | 119 | 52.1 | 3 | 0.0029 | 0.0088 |
| Epoxy | epoxy | 68.3 | 128.5 | 6.59 | 0.027 | 0.021 |
| Polyester | polyester | 75.1 | 95.5 | 4.9 | 0.027 | 0.021 |
| PVC-foam | PVC | 4.7 | 69.1 | 2.47 | 0.017 | 0.018 |
| Balsa | balsa | 11.9 | 12.2 | 0.601 | 0.0009 | 0.00094 |
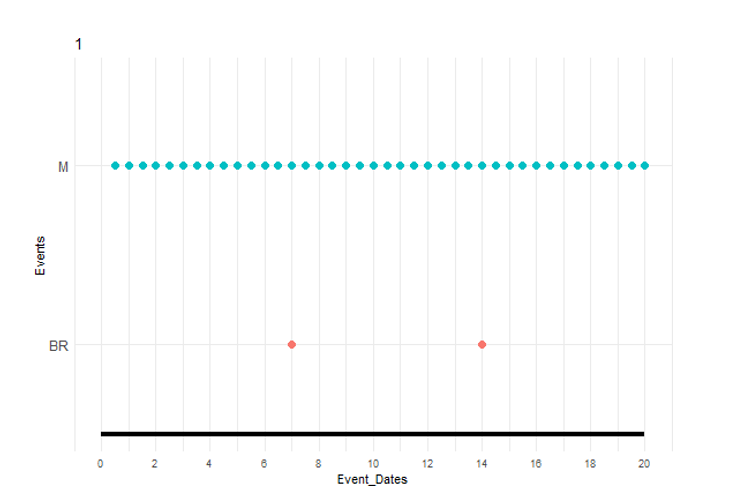
This concludes the data needed to conduct the LCA, the quantities are given by kg/m. The unit for energy is given by MJ/kg, for CO2, NOx and SO2 the unit is kg/kg. Now for each of the three options, the total emissions can be calculated and be compared. Depending on the number of maintenance and repairs more materials are used up and more emissions result. The downtime during these repairs is called an intervention. The maintenance interval for rotor blades is twice a year and approximately every 7 years a breakdown replacement repair is conducted (Chan & Mo, 2017). After thorough research no data was found that results in different repair intervals for the materials used in this project. For each option, the same number of interventions is assumed, because the options can be evenly compared this way.
3. Emissions analysis
The above chosen data is now put into a R code to calculate the total emissions over the entire lifetime of the rotor blade. One thing that needs to be kept in mind while looking at the results is that the data describes a single wind turbine rotor blade. A wind turbine uses three rotor blades, therefore the total emissions a single wind turbine produces through rotor blades is three times the following results. The resulting four tables show which options result in more emissions based on the materials used. With this analysis we hope to gain insights whether certain materials have a worse impact on the environment. The results can help to eliminate damaging materials and find the most efficient design options.
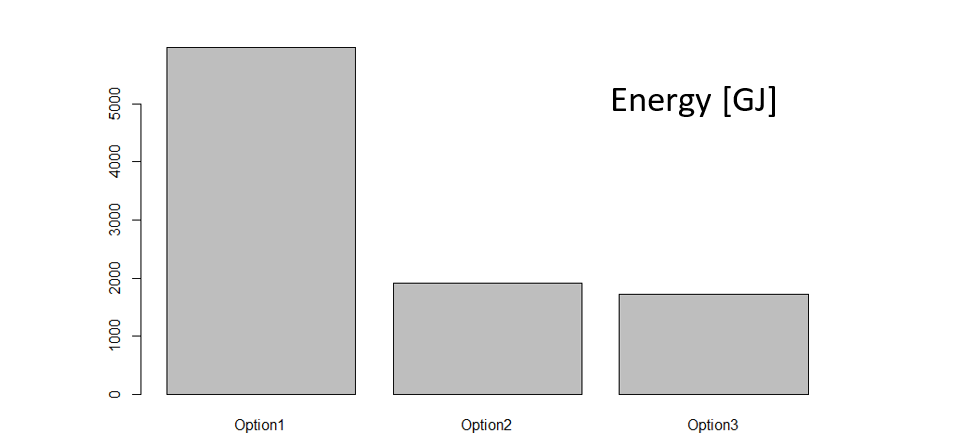
For the Energy consumption, Carbon fibre, Epoxy and PVC-foam have the highest per kg usage in their given category. Even though they are all used in lower quantities than their counter option, option 1 consumes by far the most energy, while containing all three of the mentioned materials. The difference between Option 2 and 3 is very slim, form which we can conclude that the resin and sandwich materials do not have a significant impact on the energy consumption.
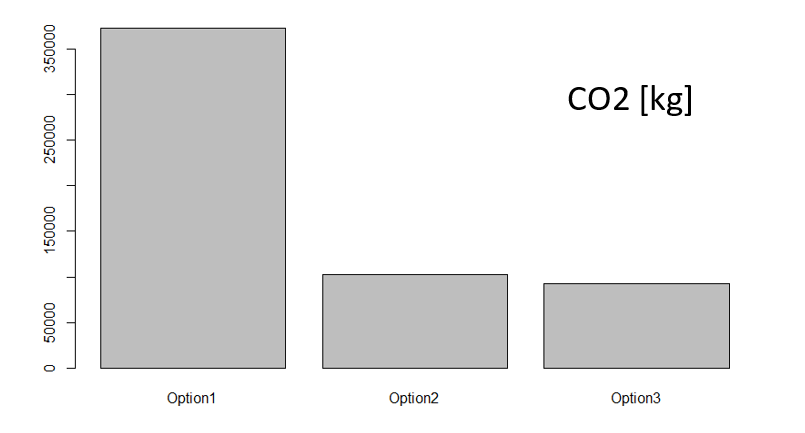
For the CO2 table the exact same observations can be made. Once again option 1 contains the leading polutioner from each category and the resulting most overall CO2 emissions. The lacking difference between options 2 and 3 once again shows low impact from sandwich and resin materials.
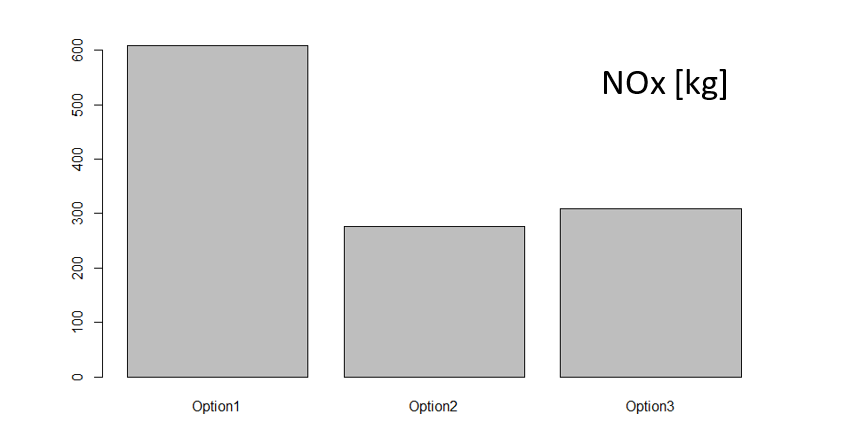
For NOx, the differences start to get smaller, but once again option 1 emits the most. Taking that into account, it can clearly be said that carbon fibre is by far the most environmental liability, because only option 1 contains it and has exceeded the other two options by far. One change is that Option 3 has more NOx emissions than option 2, the difference is also more significant compared to Energy consumption and CO2 emissions. As the resin materials have similar quantities and emissions per kg, it is fair to say that PVC-foam causes the inflated NOx emissions for option 3 compared to option 2.
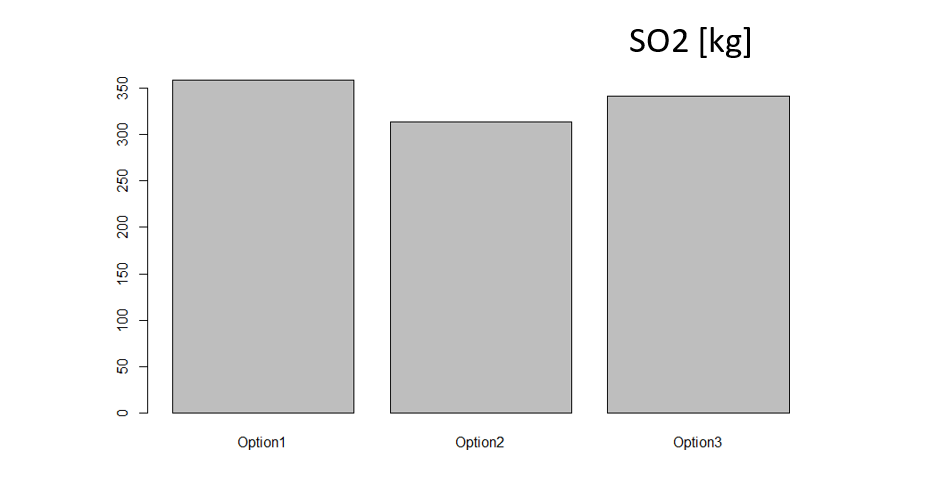
The SO2 emissions are very evenly distributed and no option is clearly worse than the other two. Even though there are slight differences, all three options can be considered if the SO2 emission was the deciding factor. Looking at all four tables altogether, option 1 can be disregarded, if the goal is to emit the least amount of any of the four considered values. But this does not take into account specific attributes of materials. If carbon fibre is more efficient or more durable, the usage can be validated. But looking at environmental friendly options, carbon fibre should not be used.
The same arguments can not be made for any of the resin or sandwich materials. Whether option 2 or 3 is superior can not be stated by comparing total emissions of four different criteria. Such a problem is called multi criteria decision-making problem (MCDM). As the name suggests, multiple criteria are of importance and weighted differently. To receive a clearer image of the importance and which option is superior, an AHP (MCDM method) analysis will be conducted in the next step.
1. AHP analysis
Analytic Hierarchy Process (AHP) is a method to analyse a complex decision-making problem. AHP organizes criteria and uses math and subjective values to compare alternatives. The goal of an AHP analysis is to receive a clear image of what options are the best comparing criteria and alternatives. It gives an in-depth analysis that does not only look at total numbers and accordingly provides valuable information on multi criteria decision-making problems.
To receive results, MCDA implementations must be made. This works by comparing each of the alternatives pairwise, depending on the criteria looked at. In this case the criteria are energy, CO2, NOx and SO2. The pairwise comparison weights one alternative against the other. For example, if the criterion is CO2 and option 1 and 2 are compared, option 2 might be emitting less CO2 and can therefore be categorised stronger. How strong can be evaluated from 1-9 based on the model of (Saaty, 1980). This process is made for each pair and put into the form of a matrix. Each matrix for a different criterion. At the end one matrix is made comparing and weighting the criteria.
To weight the criteria, it is important to note each criterion´s effects on the environment. Energy is a very diverse resource, as it is generated in different ways. While Germany relies heavy on renewable energy, the country still runs coal power plants. Especially energy generated from fossil fuels causes SO2, CO and NOx emissions (Just Energy, 2023). CO2 is a gas that contributes to the warming effect of the earth and the resulting climate change. The vast number of problems accompanied by climate change are felt today, including rising sea levels and an increasing number of natural disasters (European Environment Agency, 2007).
NOx is a gas that reacts in the atmosphere and results in higher Tropospheric ozone, which causes damage to human health and vegetation (European Environment Agency, 2007). NOx and SO2 both cause acidification which can lead to acid rain and therefore change in soil and water quality. This directly damages ecosystems like rivers and rises health concerns when contaminating groundwater for public water supply. Around 56% of SO2 emissions result from public electricity and heat production (European Environment Agency, 2007).
From the above given information the matrix for the criteria was chosen. As NOx and SO2 have direct impact on the ecosystem and health, they were ranked higher than energy and CO2. Because energy production produces 56% of SO2 emissions, energy was ranked higher only in that exact pair. The final weighting can be seen in the code, the conclusive AHP results are shown in the pie graph below:
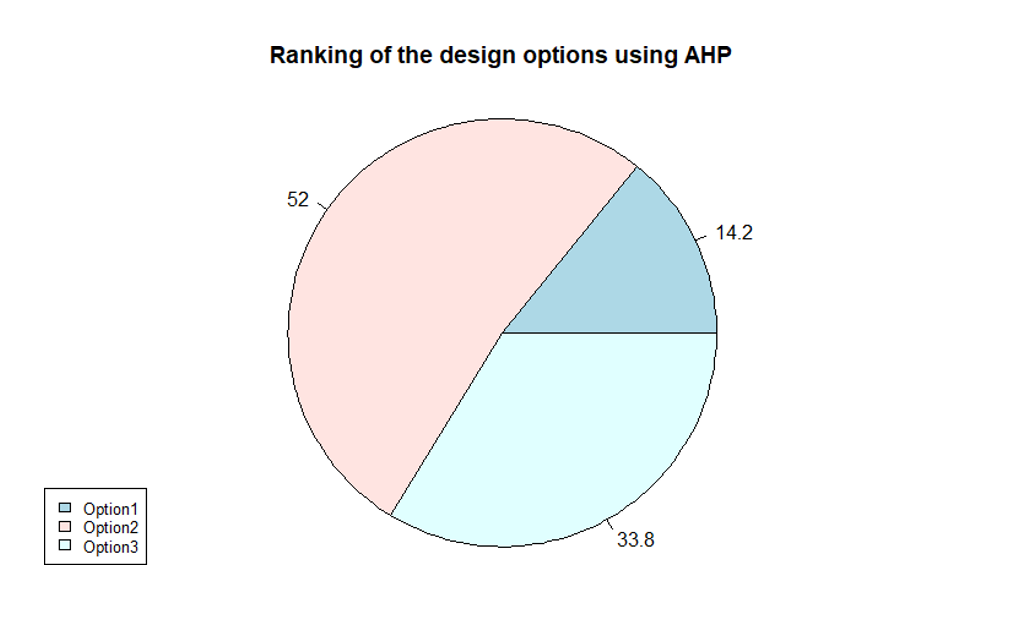
Looking at the analysis of the results of 3., no statement could be made about the best option between 2 and 3. The pie graph above shows that option 2 is ranked 18.2% better than option 3, which is a big difference. It also confirms the initial degradation of option 1 as the worst option among the three. From an engineering perspective, this gives valuable information needed to decide between options of a wind turbine´s rotor blade and its´ impact towards the environment. The big difference is likely to be the balsa wood. Even though more mass of balsa is used in a single rotor blade than PVC-foam, it is a naturally growing resource, that only has low per kg emissions in all four criteria. Concluding, the usage of E-glass fibres, epoxy and balsa is recommended to build the most environmentally friendly rotor blade among the tested materials.
Home Page | Maintenance Strategies | Life Cycle Analysis | Multi Objective Optimization