Description
For the defined system on Bonaire Island, optimal solutions need to be found through a pareto front. Our focus lies on the optimization of the following three design parameters for each system:
- maximum energy production
- minimum CO2 emissions
- maximum availability/reliability
Two additional goals are the maximization of time between interventions and the minimization of time, the system is unavailable due to these interventions. All parameters are linked to the factor cost, which depends on a limited yearly budget.
A function, which generates different maintenance strategies was implemented by us in R, considering the 3 maintenance types on the 3 systems, mentioned on page Timelines. Three different system alternatives are given, by changing the types of subsystems. These three forms of products should give us various options about interventions, durations, energy consumption, CO2 emissions and cost. Also the function, which had non-linear tendencies should give a point cloud of options. But as shown in figure 1, the pareto front (blue line) is only drawn between two optimal points and all option points lie on a constant line with the cost of approximately 14,28 millions of $. But the duration is variable, which is also presented in the first column of the matrix of values. The problem are the other columns (energy, cost, co2), as they remain constant over the fitness-function.
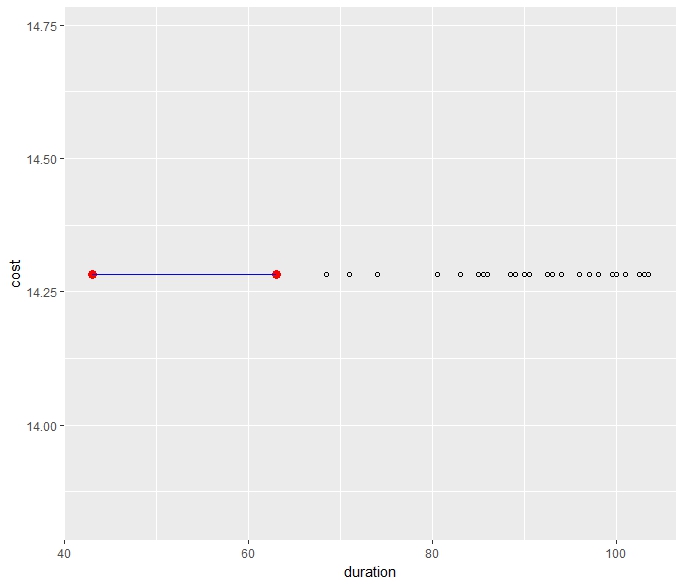 [Figure 1]: Our false pareto front
Unfortunately, our pareto front can not present realistic optimal solutions. The figure 2 shows a pareto front, which is non-linear and makes sense. A good observation of possible sources of error could solve these issues.
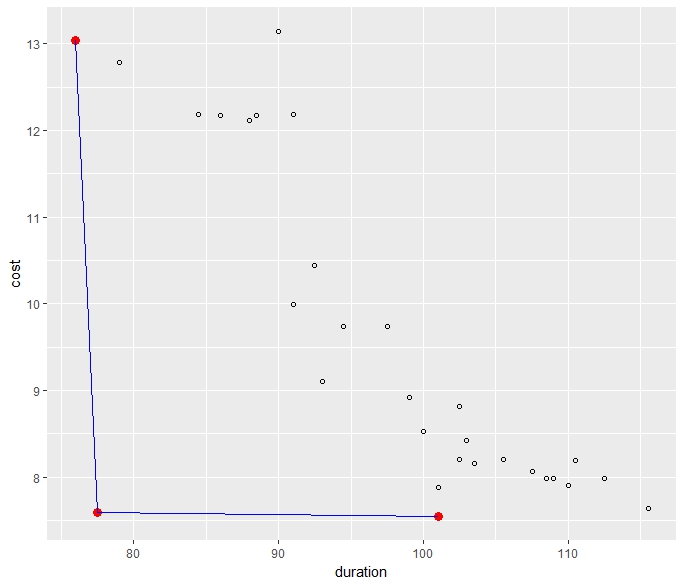 [Figure 2]: Pareto front, how it should look like
Text
[1]
Figures
[Figure 1]
All sources last viewed 2018-02-12.