As civil engineers, the design and construction of buildings, especially in the case of schools, require a long-term perspective in order to ensure their functionality, durability, and reliability over time. These structures play a critical role in the education sector, and their design and maintenance must take into account various factors such as daily usage, exposure to weather conditions, and the potential for extreme events.
To mitigate the effects of these factors and ensure the longevity of the building and its subsystems, a well-planned and executed maintenance strategy is essential. According to [2], maintenance activities can be broadly categorized into preventive and corrective actions. Preventive maintenance is designed to prevent the onset of degradation and maintain the overall operational capacity of the structure, whereas corrective maintenance is focused on repairing existing damage and restoring the structure to its original condition. While preventive maintenance activities are typically smaller in scale, corrective maintenance activities can be more extensive and require more in-depth examination of the structure. By implementing both types of maintenance, it is possible to maximize the longevity and efficiency of the school and its subsystems, while minimizing costs associated with maintenance over the lifetime of the structure.
To integrate the maintenance strategies individual plans are required. To give an overview the following lines of the R script explain the maintenance, repair, and replacement intervals as well as the duration.
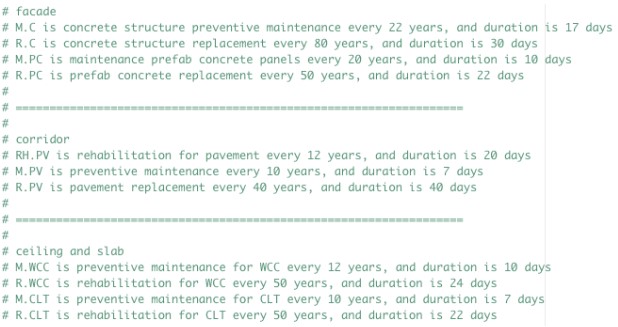
Figure 3: An overview of the following lines of the R script explains the maintenance, repair, replacement intervals, & duration.
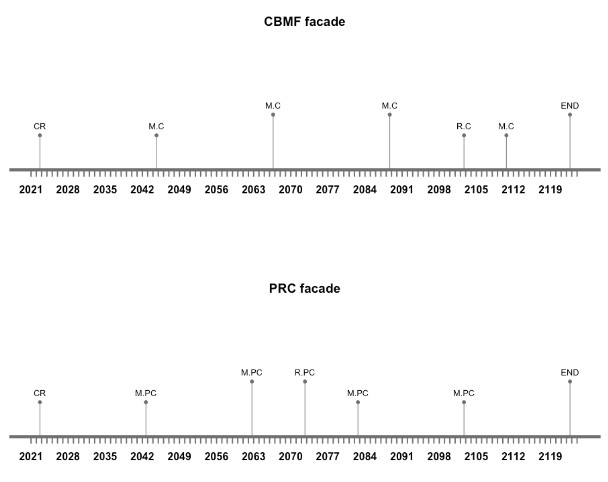
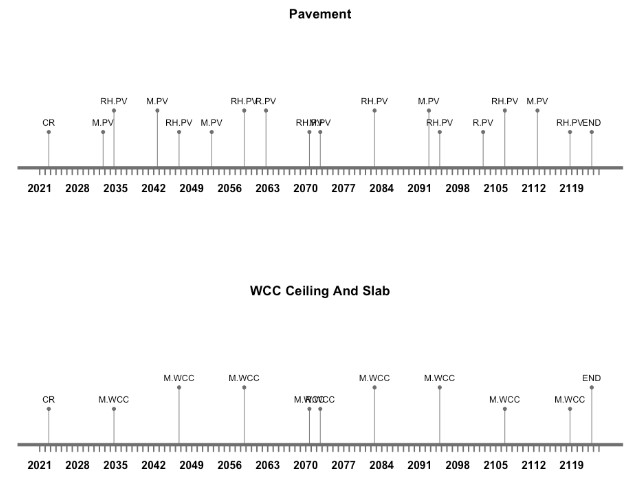
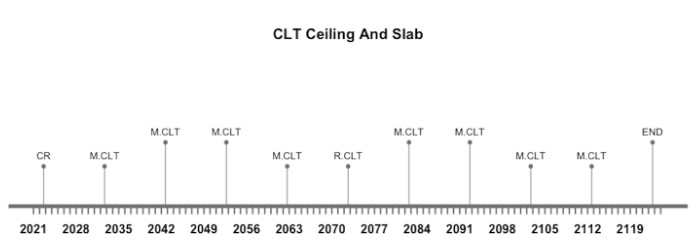
Figure 4: Life Cycle Timelines for different design options.
INTEGRATED MAINTENANCE
By creating a combined maintenance plan for the system options mentioned in chapter 2, the different durations for interventions are calculated. The results show that design option 4 with PRC, pavement and CLT reaches the best results for the goal of minimizing the duration of the interventions and maximizing the gap between them.
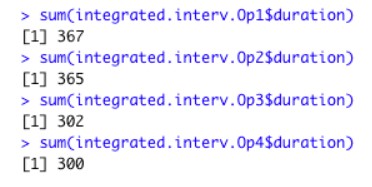
Figure 5: Calculation of different durations for the interventions.
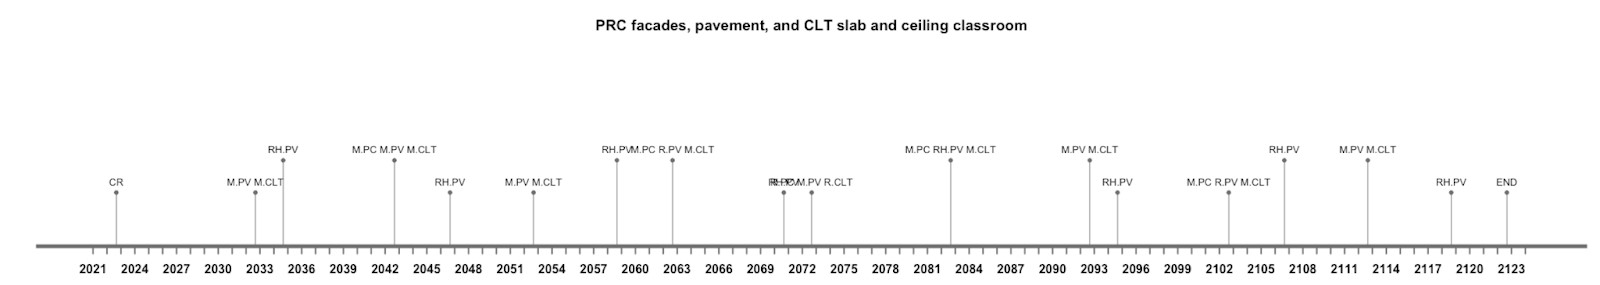
Figure 6: The results in the above figure timeline show the integrated maintenance plan.
Using the Pareto analysis as a tool of multi-objective optimization to find solutions that balance multiple conflicting systems. For a sufficient number of samples the n.grid was set to 4. The Pareto chart in Figure 7 shows one set of solutions with 237 samples, which represents the best trade-off between the chosen subsystems in design option 4. As one can see the plot shows the dependency of the distance between interventions (dist. inter) and the duration of interventions (dur). Finding the optimal solution means maximizing the time between interventions and minimizing the duration.
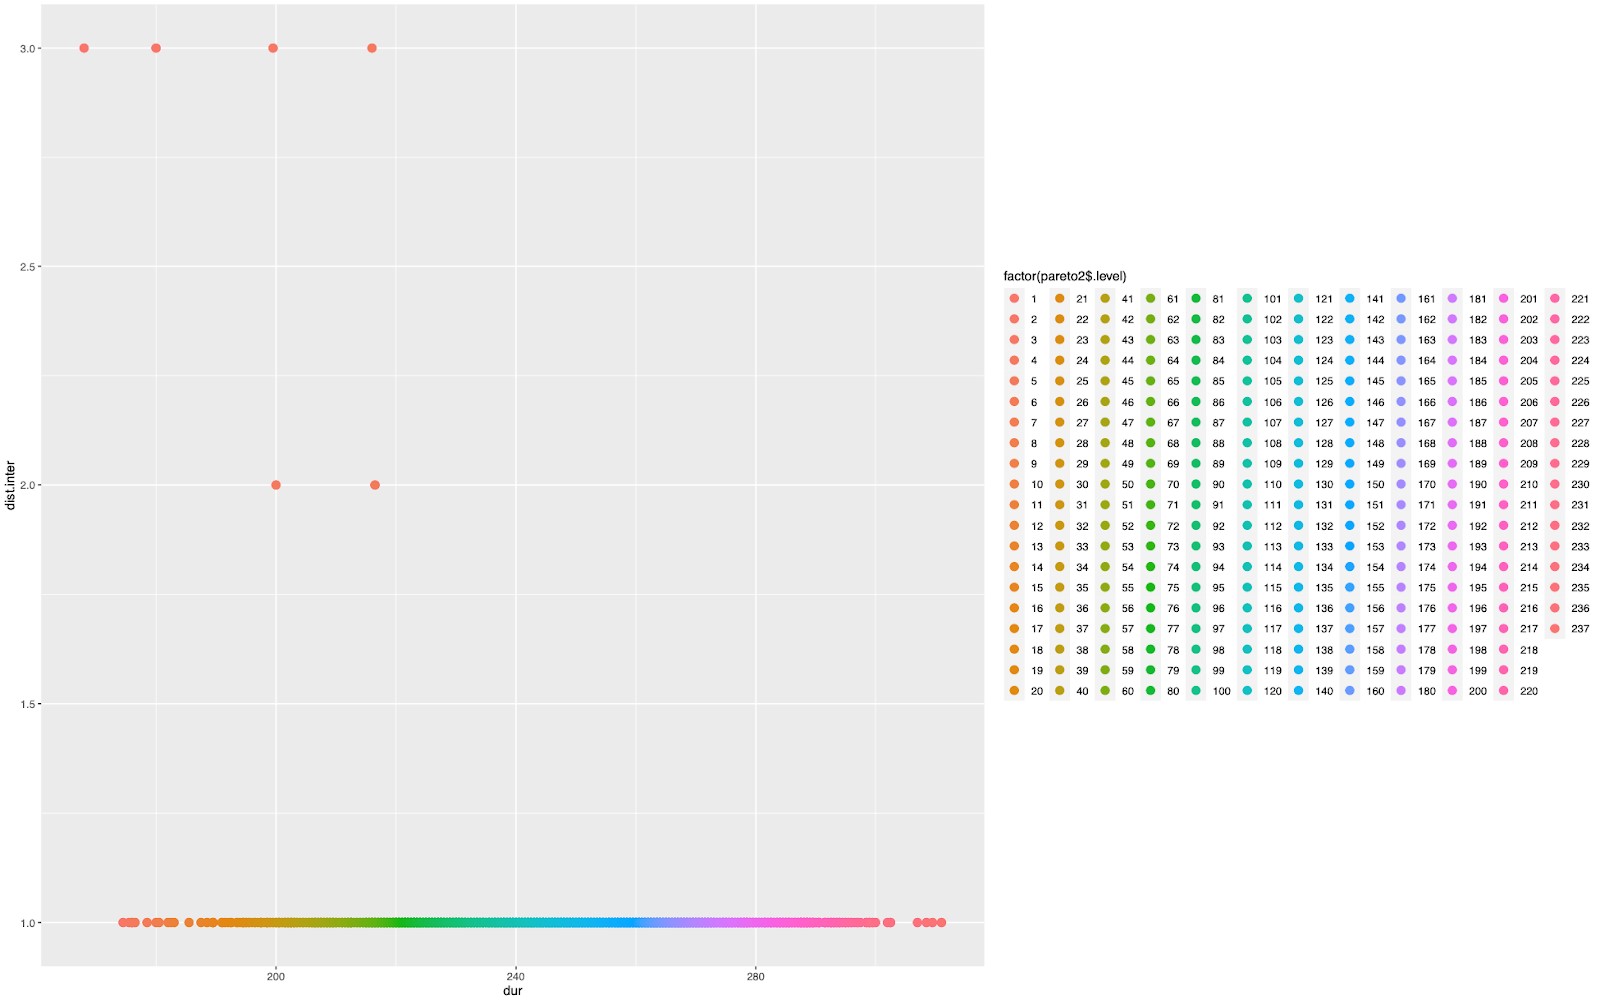
Figure 7: The pareto chart showing a set of solutions with 237 samples.
To evaluate the ranking of the samples, the two plots in Figure 8 are shown. There one can see in addition to the samples the pareto frontier, which identifies the best and the worst solutions according to the preferences chosen. The highlighted black points present the optimal (upper graph) and the not ideal (lower graph) solution. The optimal solution has 3 years between interventions and ca. 165 days duration time. The worst solution owns 1 year between interventions and > 300 days of duration.
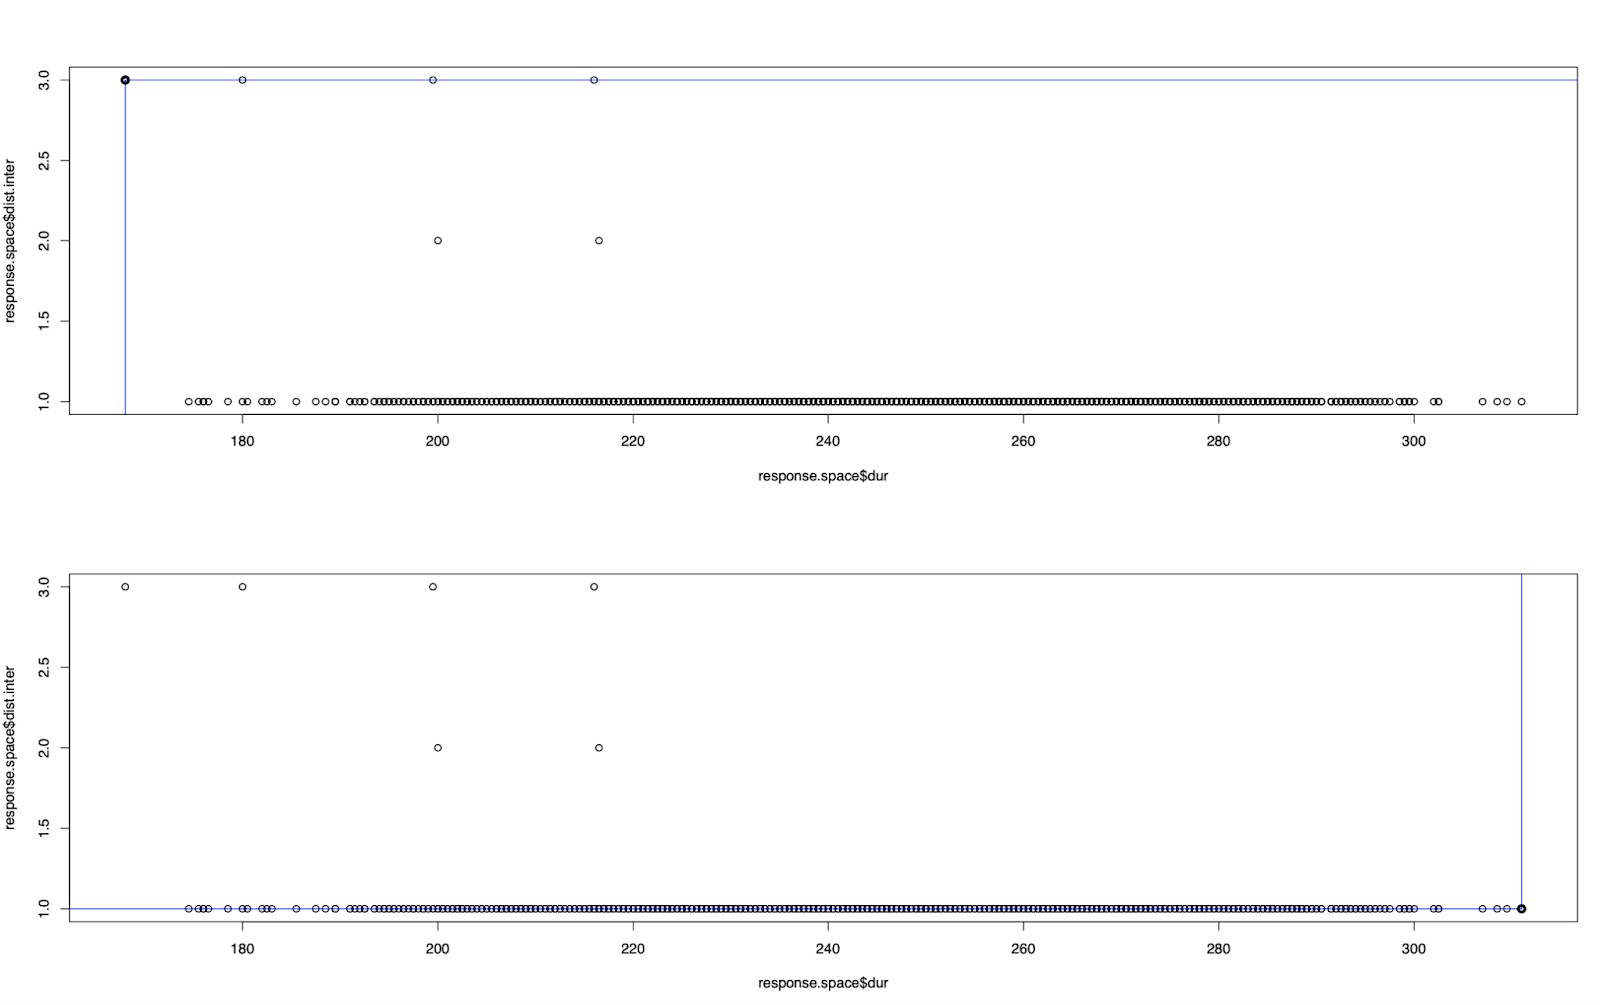
Figure 8: Evaluation of the ranking of the samples.
References:
[2] Crespo, A. The Maintenance Management Framework. Models and Methods for Complex Systems Maintenance. Chapter 6 – The Maintenance Concept. Department of Industrial Management, School of Engineering of the University of Seville. Springer. 2007.
Other sub-pages:
- Individual Systems
- Integrated Context
- Integrated Life Cycle & Inventory Analysis
- Multi Objective Optimization
Download the R-Script here: